- Instant Model Fixes: Find circular references, trace precedents, and audit entire workbooks instantly.
- Quick Chart Builder: Generate complex charts.
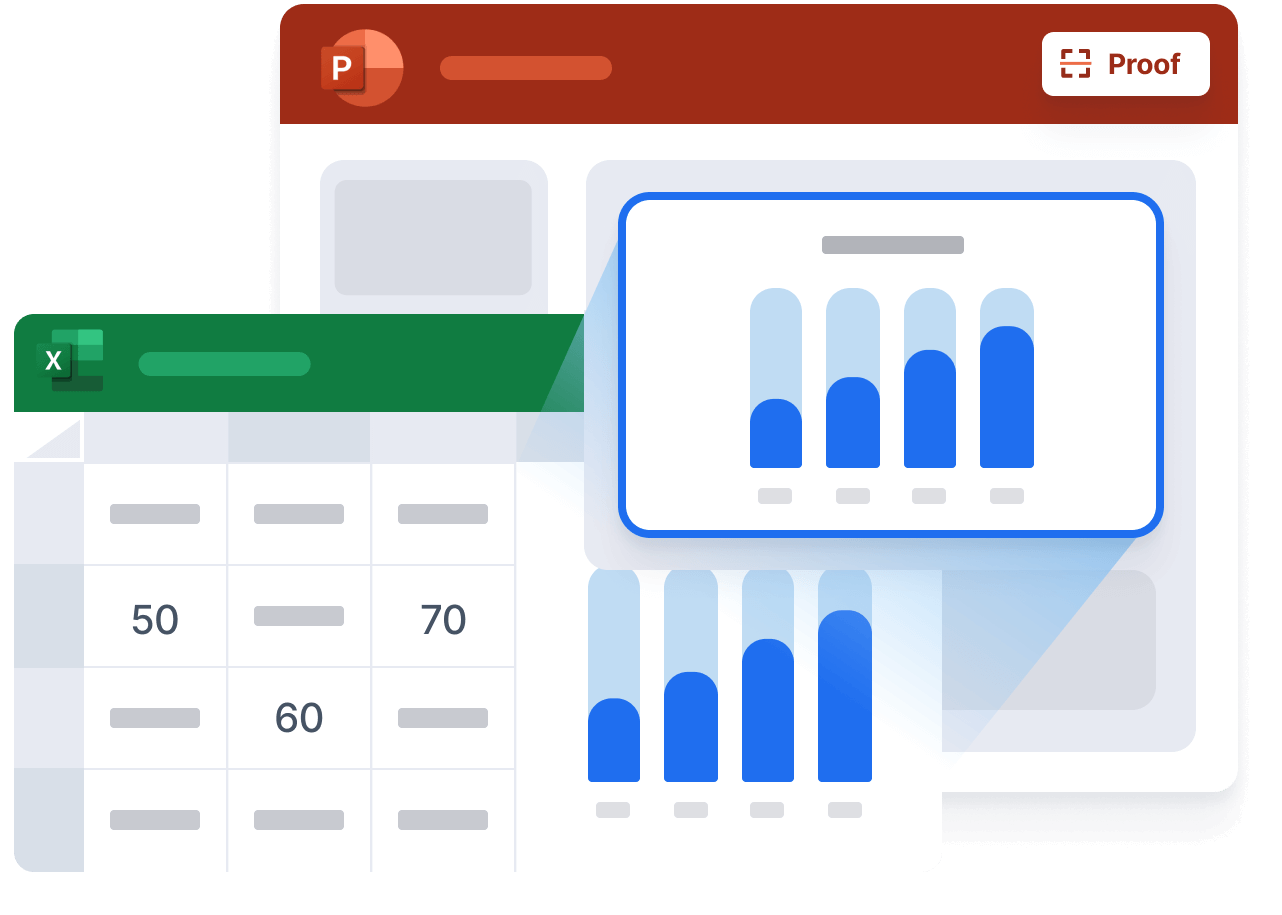
- Embed Charts & Data into PowerPoint.
- Deck Check: 100+ checks to proofread your deck.
Audit Entire Workbooks
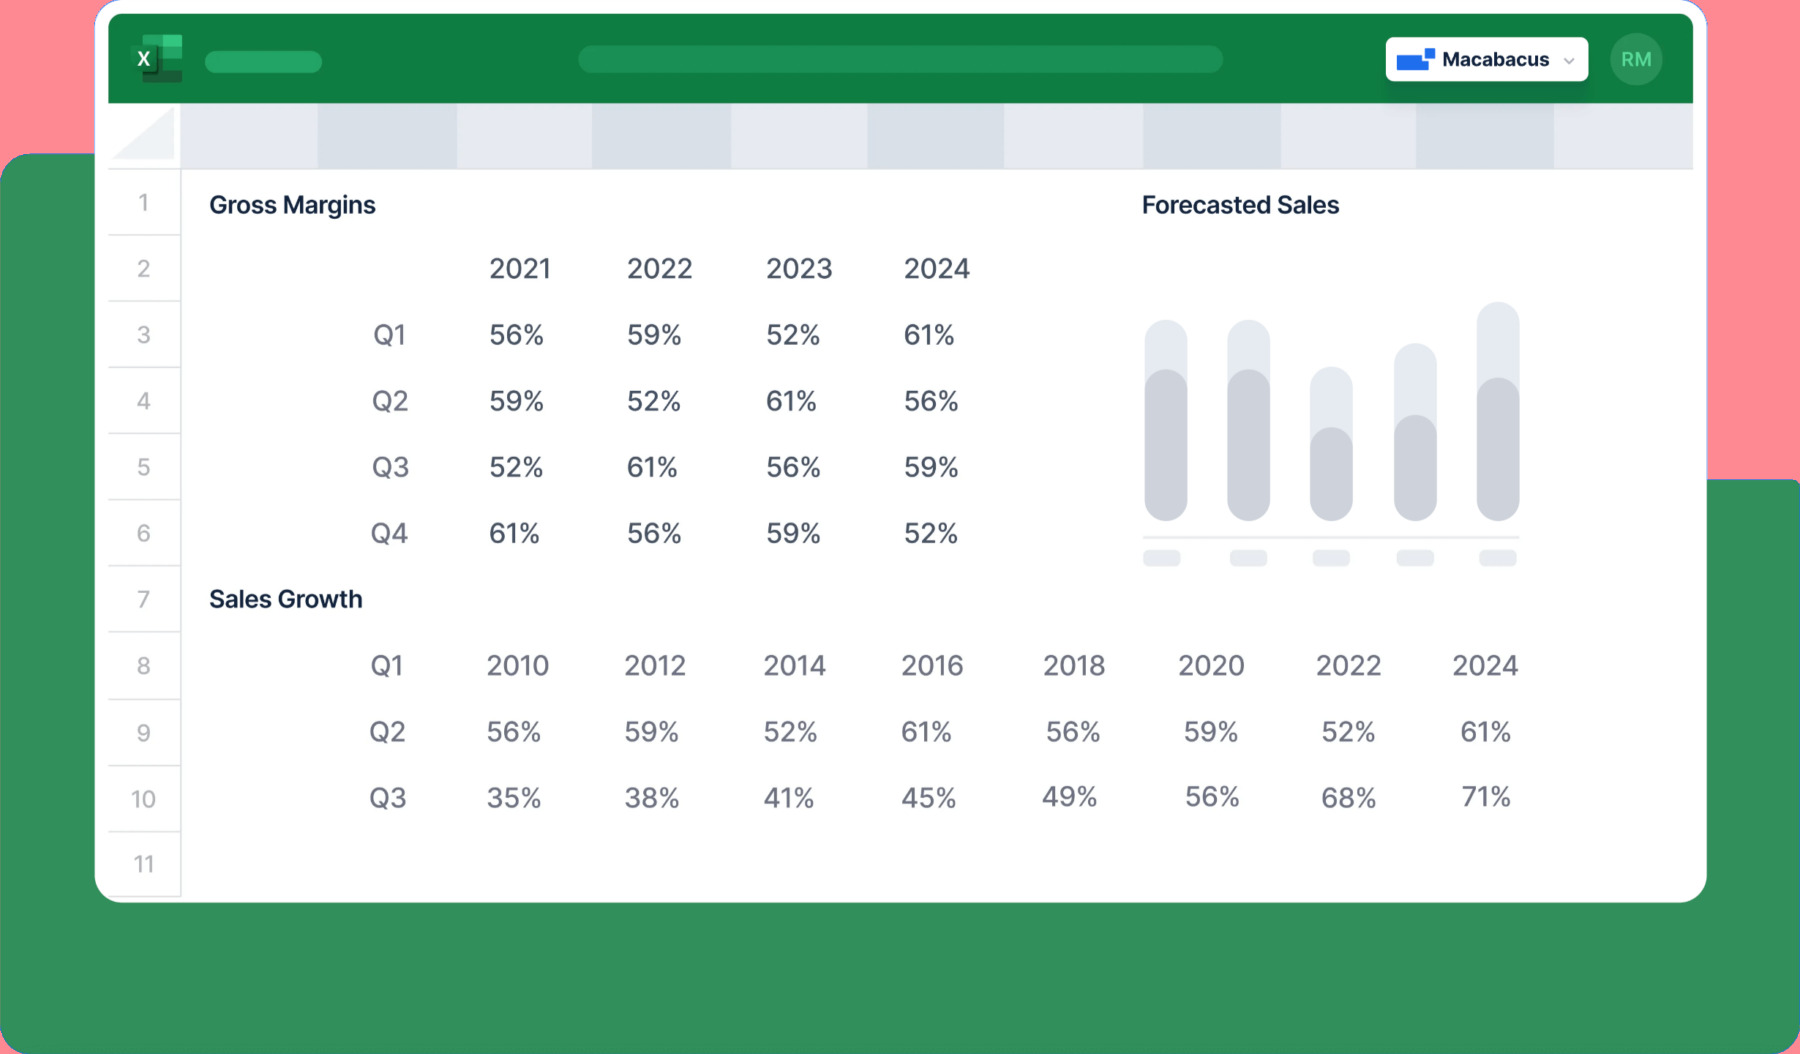
Visualize the formula structure of your financial models using patterns to quickly highlight errors and other inconsistencies. As you change the contents of cells visualized using Formula Flow, the visualization updates automatically.
Generate Complex Charts
Built specifically for banking workflows, Quick Charts ensures professional-quality visuals while eliminating hours of formatting—all while maintaining native Excel compatibility for seamless sharing with your team.
Embed Excel Data into PowerPoint
Reliably link Excel data and charts into PowerPoint presentations and Word documents. Refresh your assets with the click of a button.
Automatically Proofread Presentations
Scan slides for over 100 potential formatting issues - Find typos, distorted images, or inconsistent formatting.
Presentation Automation

Link to Excel
Agendas
Synchronize your table of contents and section slides / headers with native sections so you can focus on content.
Pagination
Support for facing pages, intentionally blank pages, slide numbering, and duplex / simplex printing.
Shape Tools
Align, resize, and otherwise manipulate shapes quickly, without tedious manual adjustment natively required.
MasterShapes
Role-based shapes like slide stamps that offer unprecedented flexibility in presentation creation.
TurboShapes
Multi-state shapes used to visualize units of measurement (e.g., percentages, relative ranking), status, and more.
Financial Modeling

Formula Auditing
Keyboard Shortcuts
Over 100 customizable shortcuts for routine formatting and other operations to turbocharge your Excel workflows.
Power Tools
Tools for power users that address common pain points to facilitate faster and more effective construction of financial models.
Visualizations
Quickly identify errors and inconsistencies in your models that could result in costly mistakes.
Charting
Create complex charts quickly, ensure their brand compliance, add components to existing charts, and much more.
Tables
Insert pre-formatted and pre-populated analyses (e.g., DCF, Black-Scholes) into your spreadsheets from a central repository.
File Optimization
Declutter and reduce the file size of spreadsheets to improve stability and performance in Excel.
