Formula to Create a Percentage Change Between Two Numbers in Excel

Formula to Create a Percentage Change Between Two Numbers in Excel

Percentage change is a core concept in data analysis, helping us see how a value shifts over time. It’s super handy in business analysis, financial reporting, and academic research. Tracking the ups and downs of key metrics is vital for making smart choices.

In this post, we’ll dive into what percentage change is, why it’s key, and how to crunch the numbers using Microsoft Excel.


Understanding Percentage Change

Percentage change shows how much a value’s gone up or down compared to its starting point. You figure it out by subtracting the original value from the new value, dividing that difference by the original value, and then multiplying by 100 to get a percentage.

Here’s the formula:

Percentage Change = ((New Value – Original Value) / Original Value) * 100

The above calculation is essential because it lets you compare changes across different scales. For example, a $1,000 bump in sales is huge for a small business but tiny for a big one. Using percentage change, we get a clearer picture of the impact on each business.

Excel Basics

Microsoft Excel is a powerhouse for calculations and data analysis. It offers a slew of functions and tools to help you easily calculate percentage changes and other important metrics.

Here are some key Excel features we’ll use:

  • Cell referencing: Using cell addresses (e.g., A1, B2) to refer to specific data points in formulas.
  • Arithmetic operators: Using symbols like + (addition), – (subtraction), * (multiplication), and / (division) to perform calculations.
  • Formatting: Changing the appearance of cells to make data easier to read and interpret.

Setting Up Your Excel Sheet

Before diving into calculations, let’s set up our Excel sheet with some sample data. We’ll use a company’s sales figures for two years.

  1. Open a new Excel workbook.
  2. In cell A1, type ‘Year’. In cells A2 and A3, type ‘2021’ and ‘2022’, respectively.
  3. In cell B1, type ‘Sales’. In cells B2 and B3, type ‘100000’ and ‘120000’, respectively.

Your Excel sheet should now look like the following:

Build Models & Decks 10x Faster with Macabacus

Gain access to 100+ shortcuts, formula auditing visualizations, easy Excel-to-PowerPoint linking, and productivity tools to build models and presentations faster than ever.

Step-by-Step Guide to Calculating Percentage Change

Now that our data is ready, let’s walk through calculating the percentage change.

Inputting the Original and New Values

In our example, the original value is the 2021 sales figure (100000), and the new value is the 2022 sales figure (120000). We already entered the cells in cells B2 and B3, respectively.

Writing the Percentage Change Formula in Excel

The percentage change formula is:

((New Value – Original Value) / Original Value) * 100

In Excel, we can use cell references to represent the new and original values in the formula. In our example, the new value is in cell B3, and the original value is in cell B2.

So, our Excel formula for percentage change will be:

=((B3-B2)/B2)*100

Let’s break down the above formula:

  • (B3-B2) calculates the difference between the new value and the original value.
  • (B3-B2)/B2 divides the difference by the original value.
  • ((B3-B2)/B2)*100 multiplies the result by 100 to convert it into a percentage.
  • The = sign at the beginning tells Excel that this is a formula.

Now, let’s enter the formula into Excel:

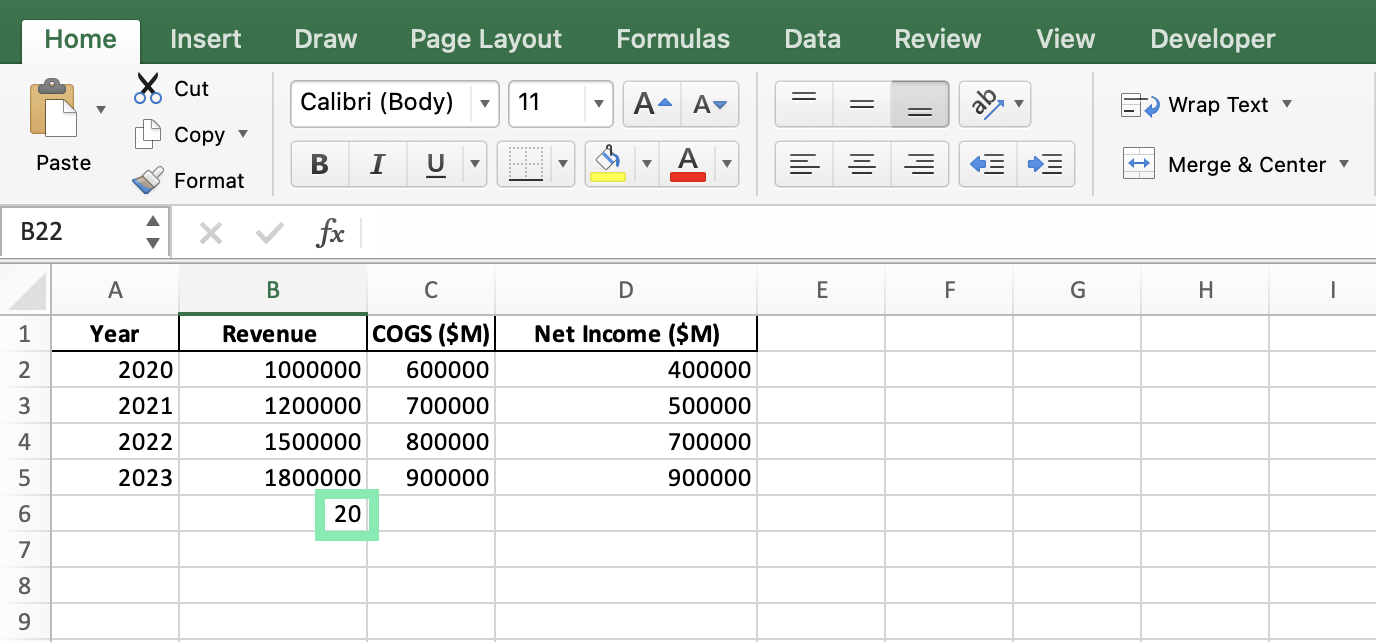
Step 1: Click on cell B6 (or any empty cell where you want the result to appear).

Step 2: Type in the formula: =((B3-B2)/B2)*100.

Step 3: Press ‘Enter’.
Formatting the Result as a Percentage

To make the result easier to read, we can format it as a percentage:

Step 1: Right-click on cell B6 and select ‘Format Cells’.
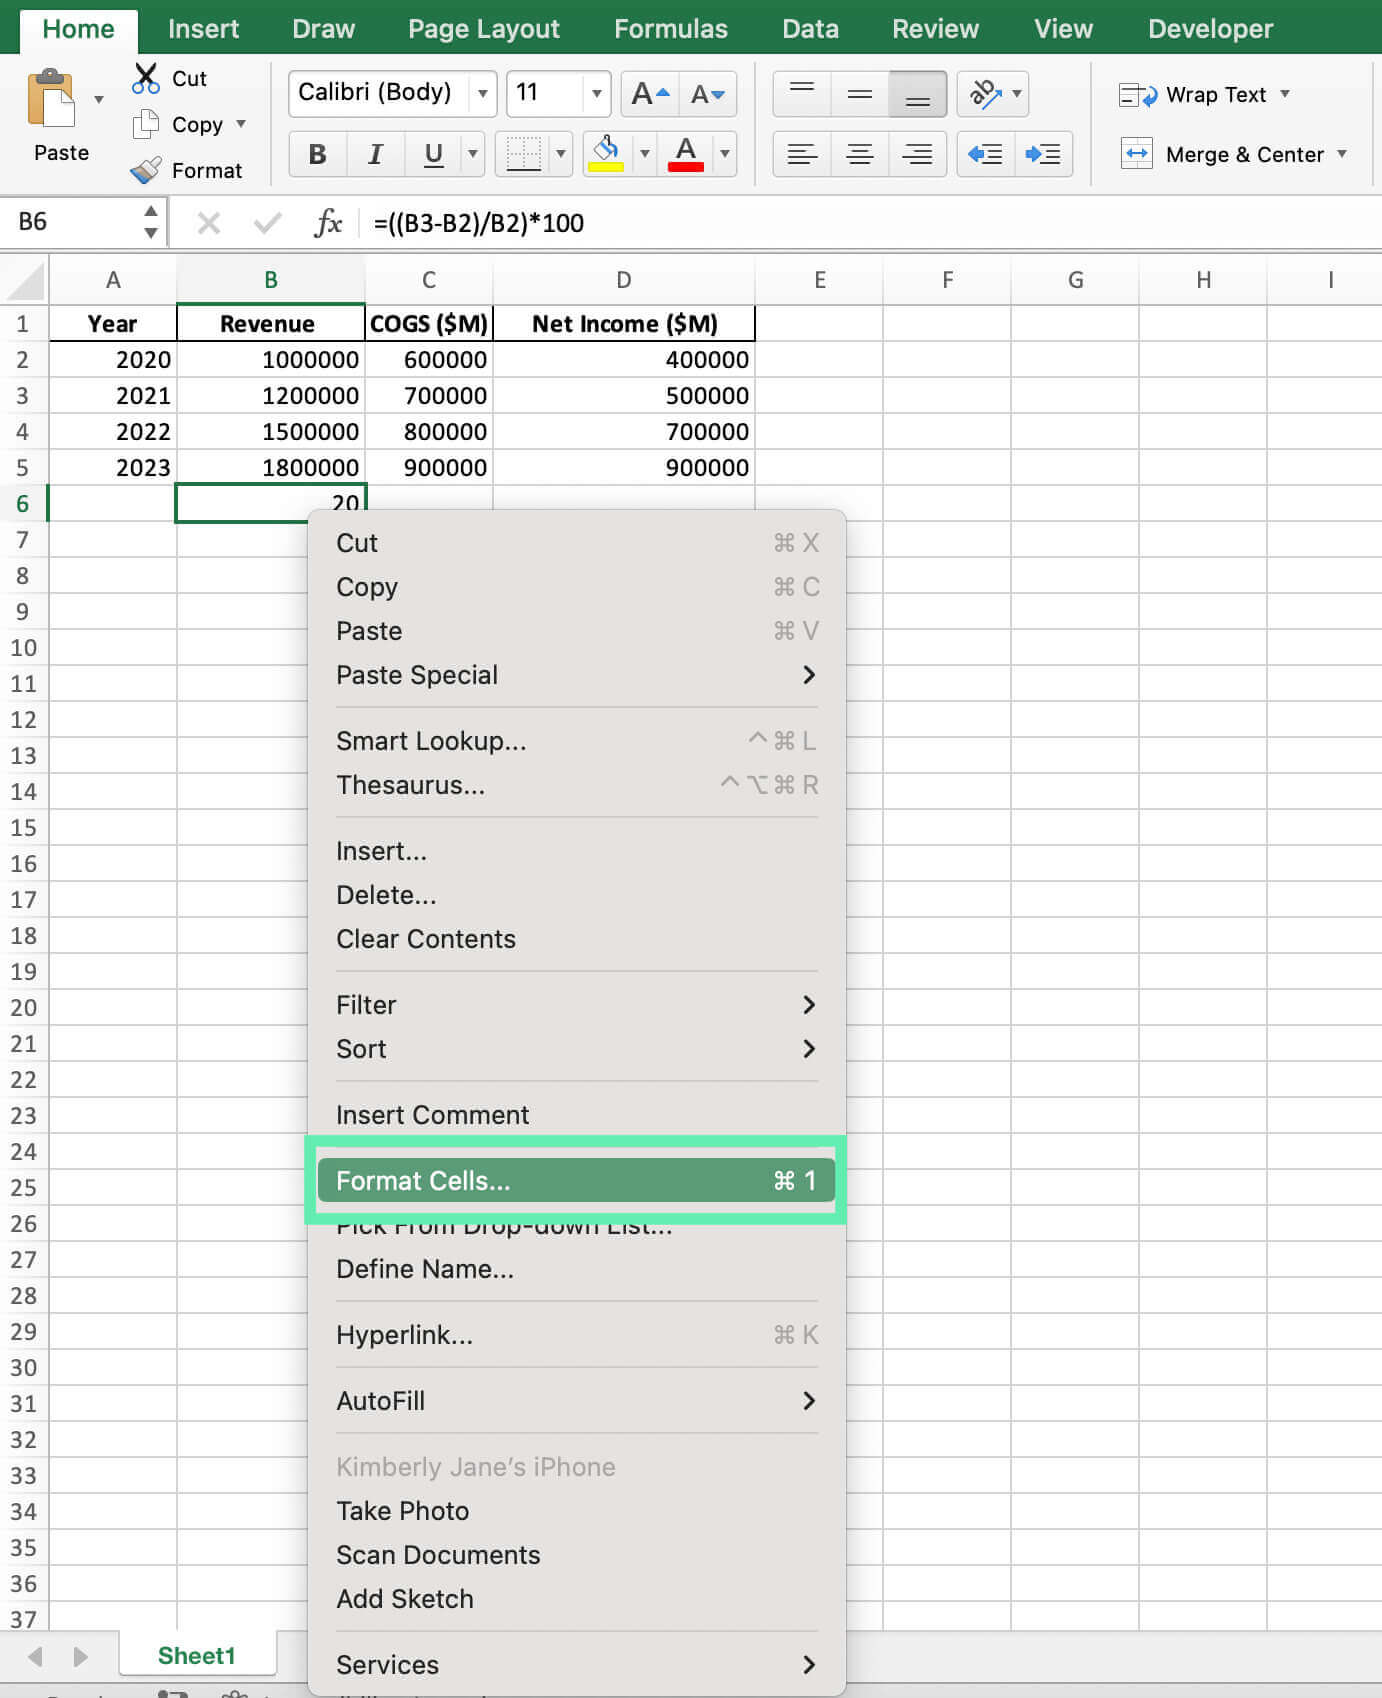
Step 2: In the ‘Format Cells’ dialog box, choose the ‘Percentage’ category. Adjust the decimal places if needed, then click ‘OK’.
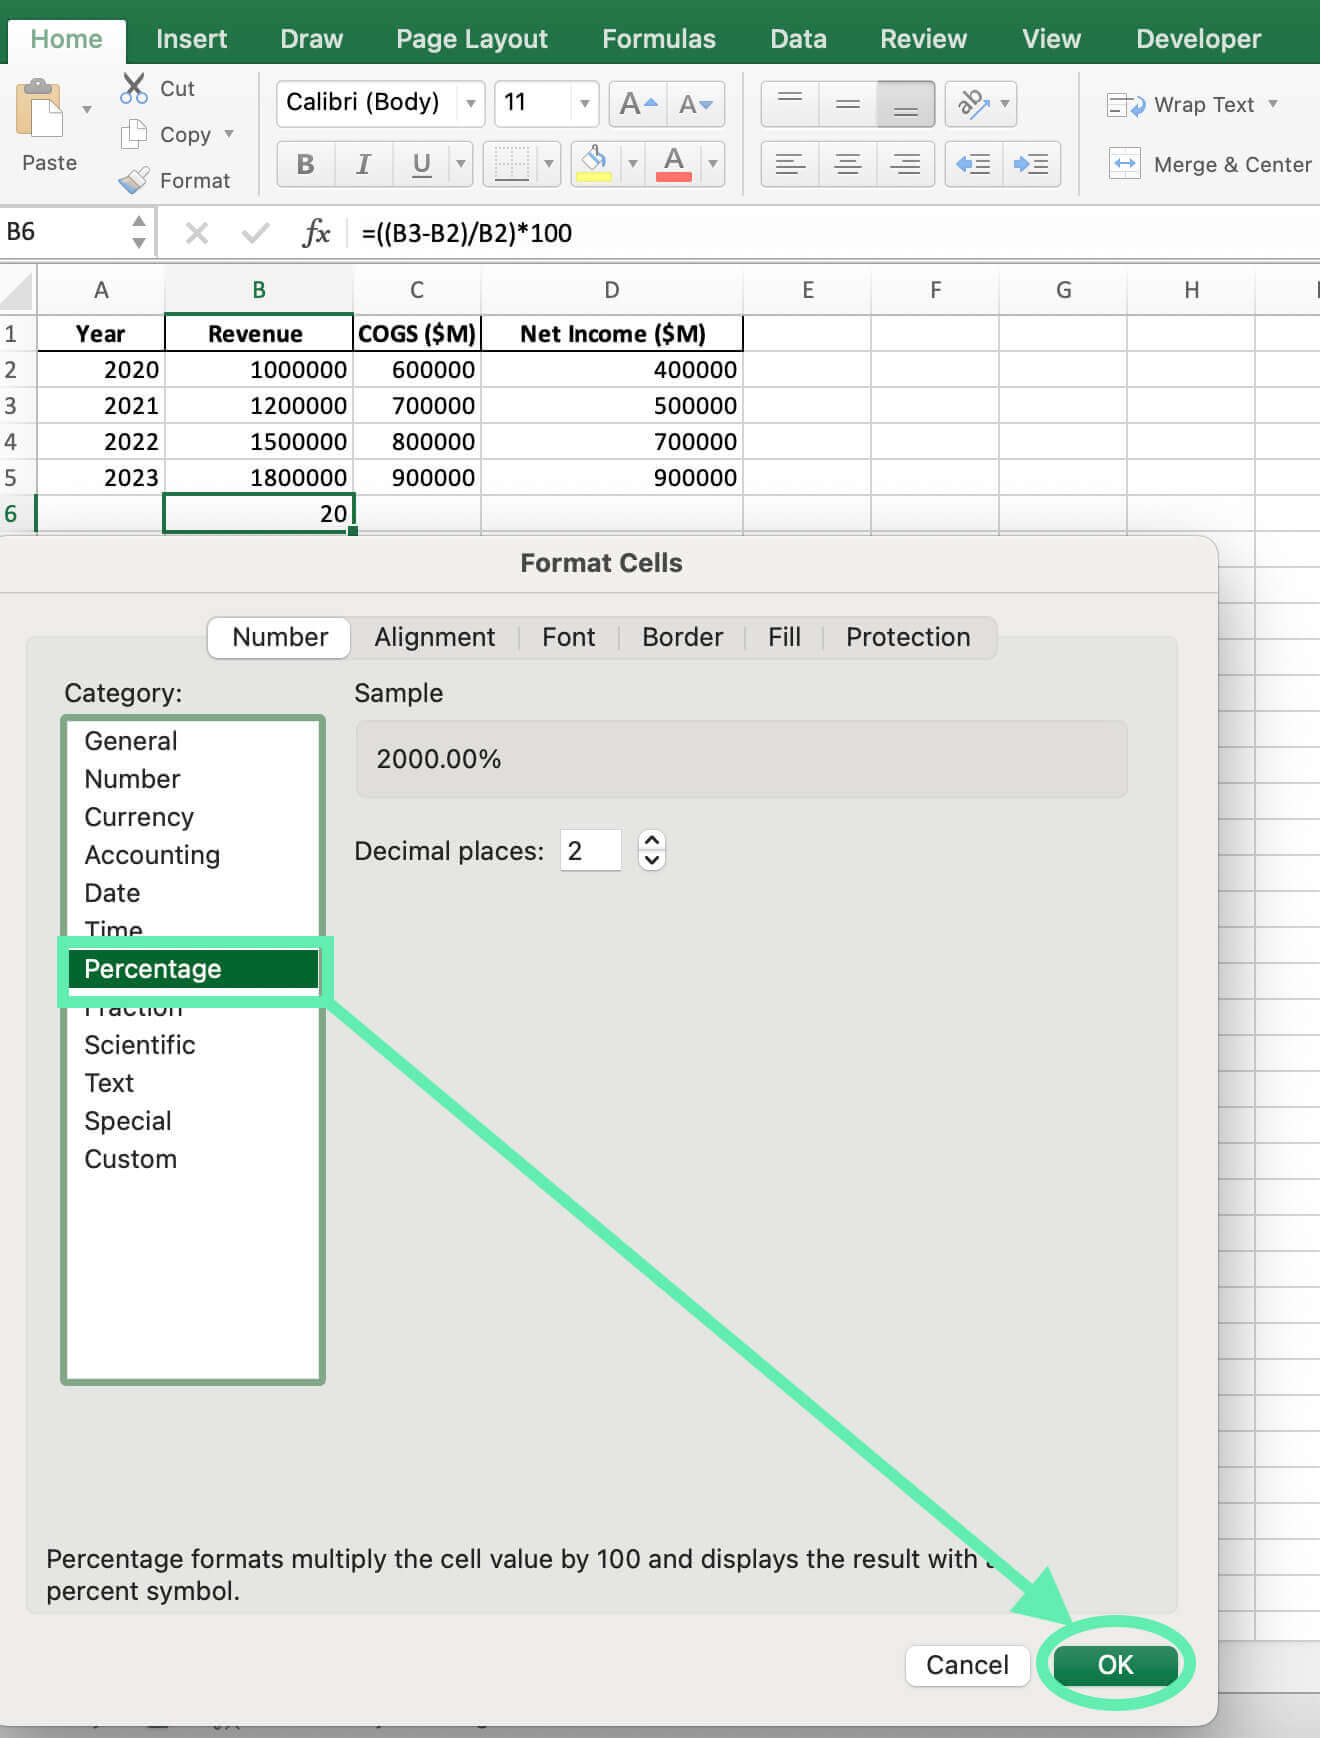
Now, cell B6 will display the result as a percentage.

Practical Examples

Now that we understand how to calculate percentage change in Excel, let’s apply this knowledge to some practical examples.

Example 1: Calculating Sales Growth

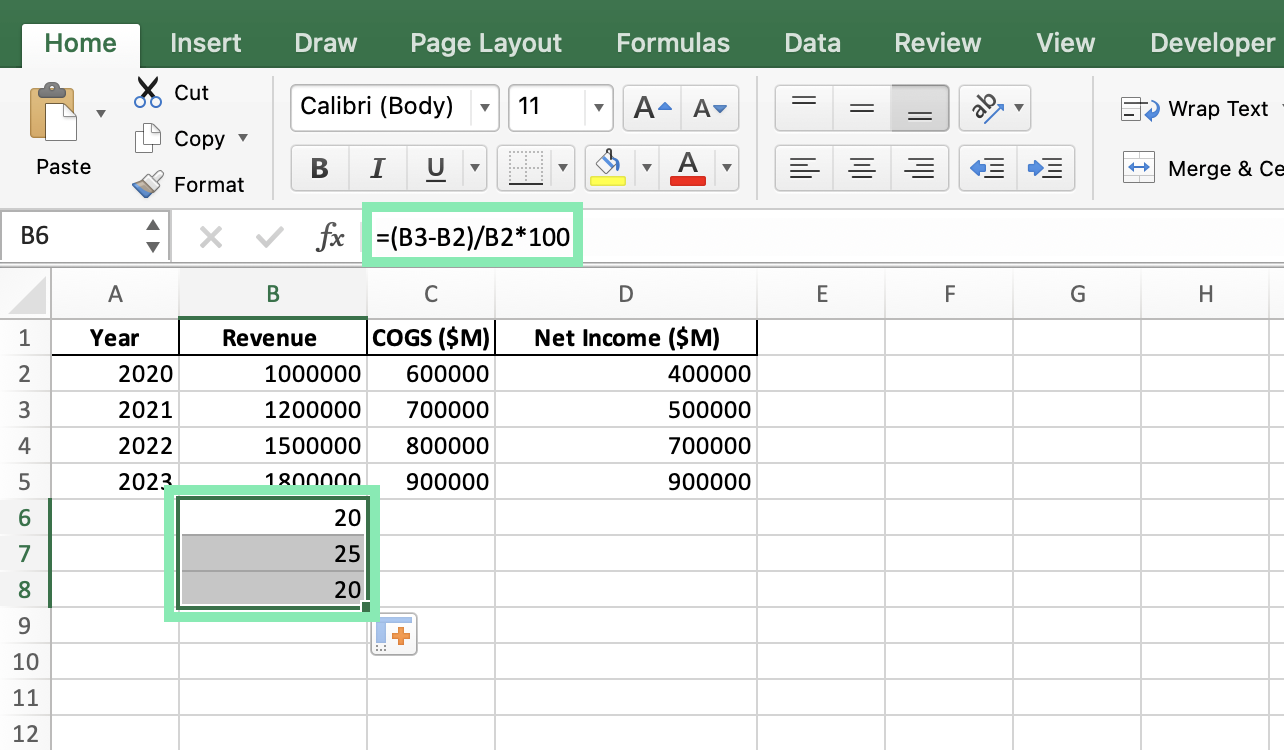
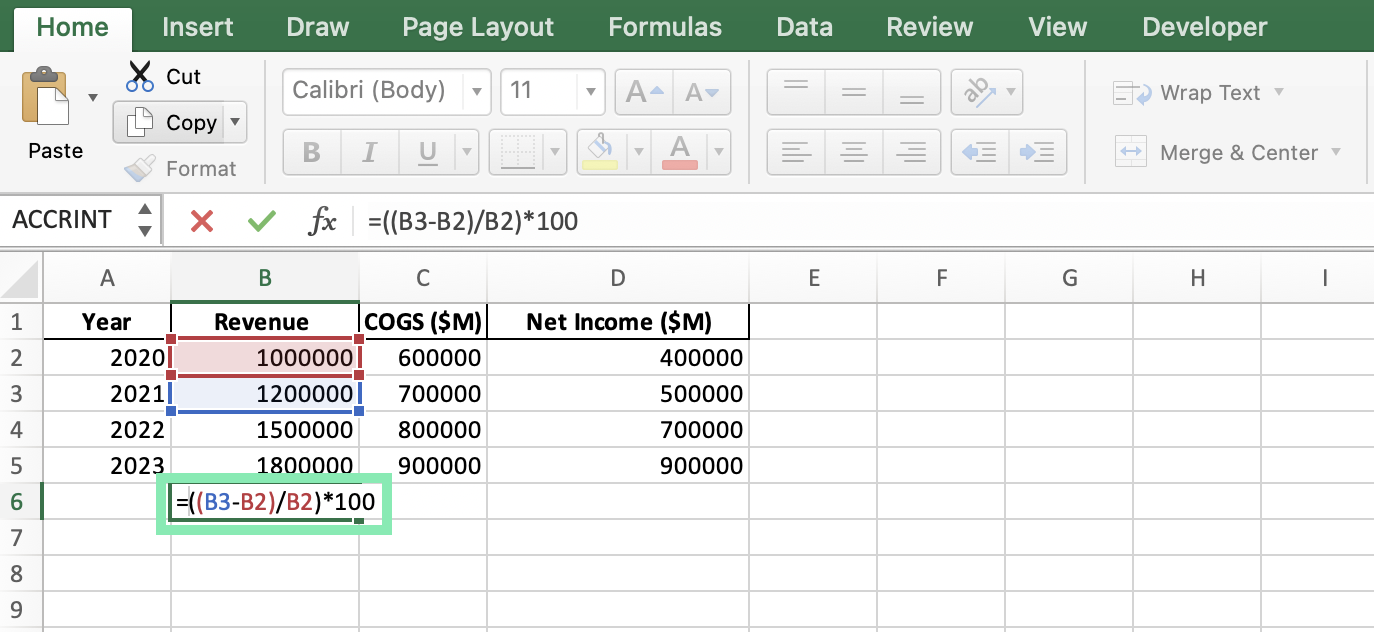
Below is a dataset of a company’s sales figures from 2020 to 2023:

To calculate the year-over-year percentage changes in Revenue and Net Income:

Step 1: Set up the formula for percentage change in Revenue:

  • In cell B6, type: =(B3-B2)/B2*100

  • Copy the formula to cells B7 and B8.

Step 2: Set up the formula for percentage change in Net Income:

  • In cell D6, type: =(D3-D2)/D2*100

  • Copy the formula to cells D7 and D8.

Step 3: Format the results as percentages.
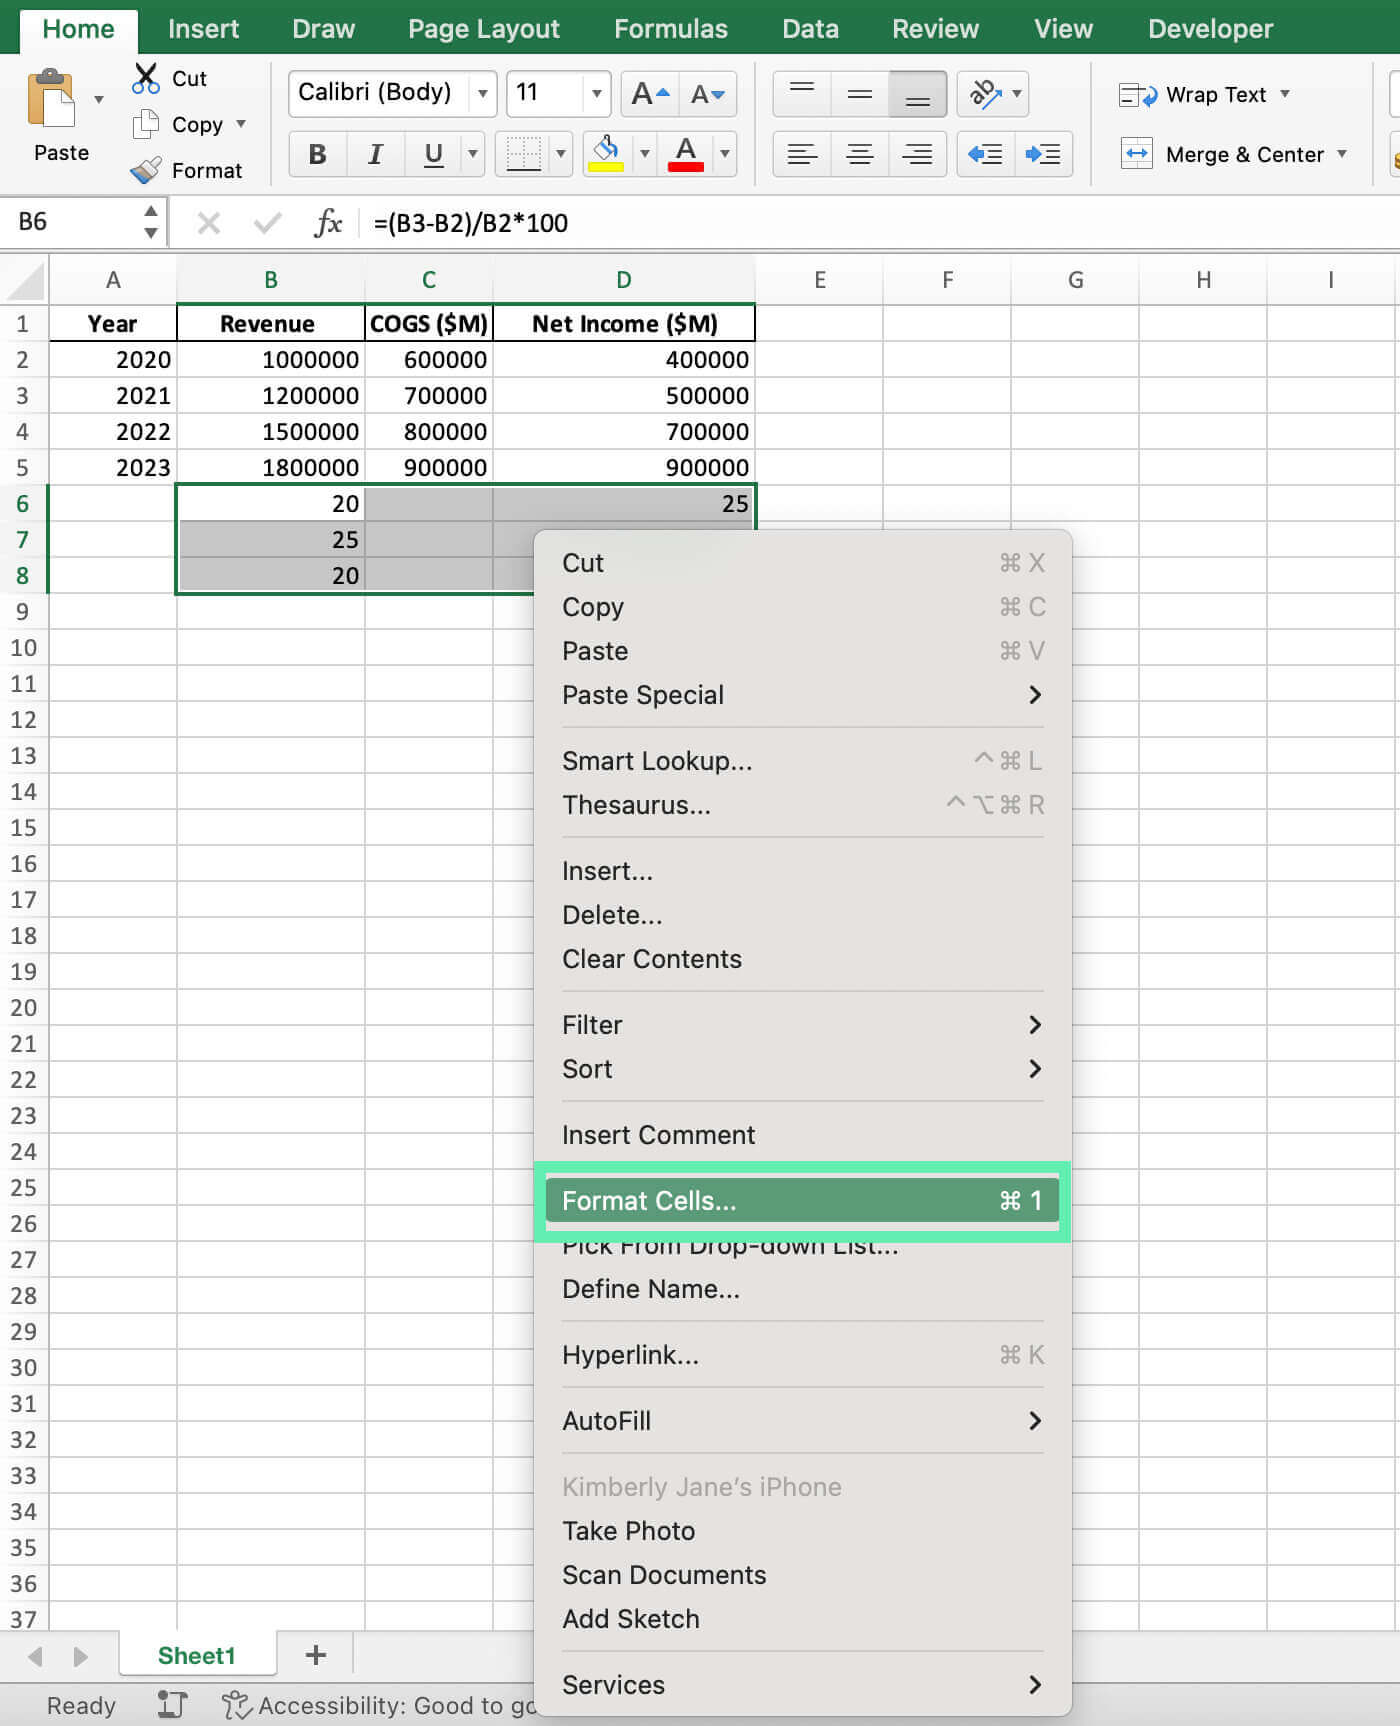
It will show the year-over-year growth rates for Revenue and Net Income, helping assess financial health and guide investments.

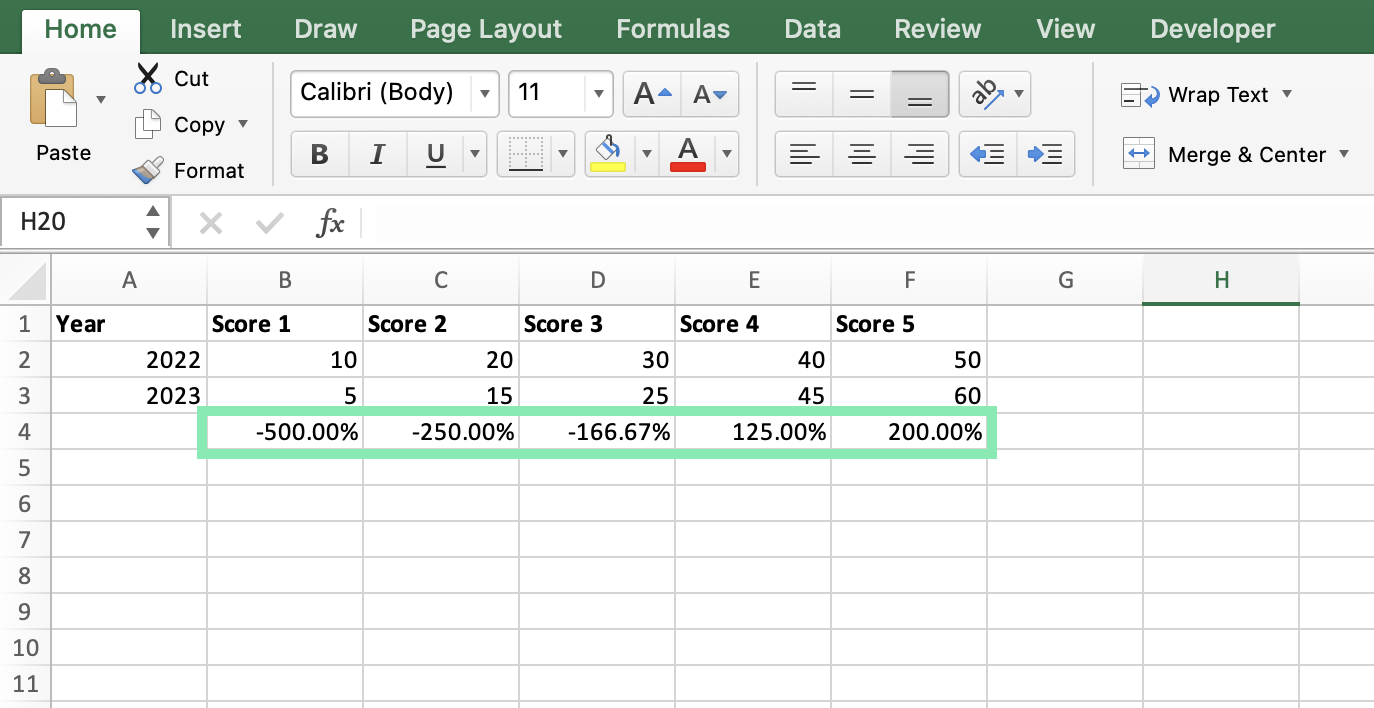
Example 2: Analyzing Survey Results

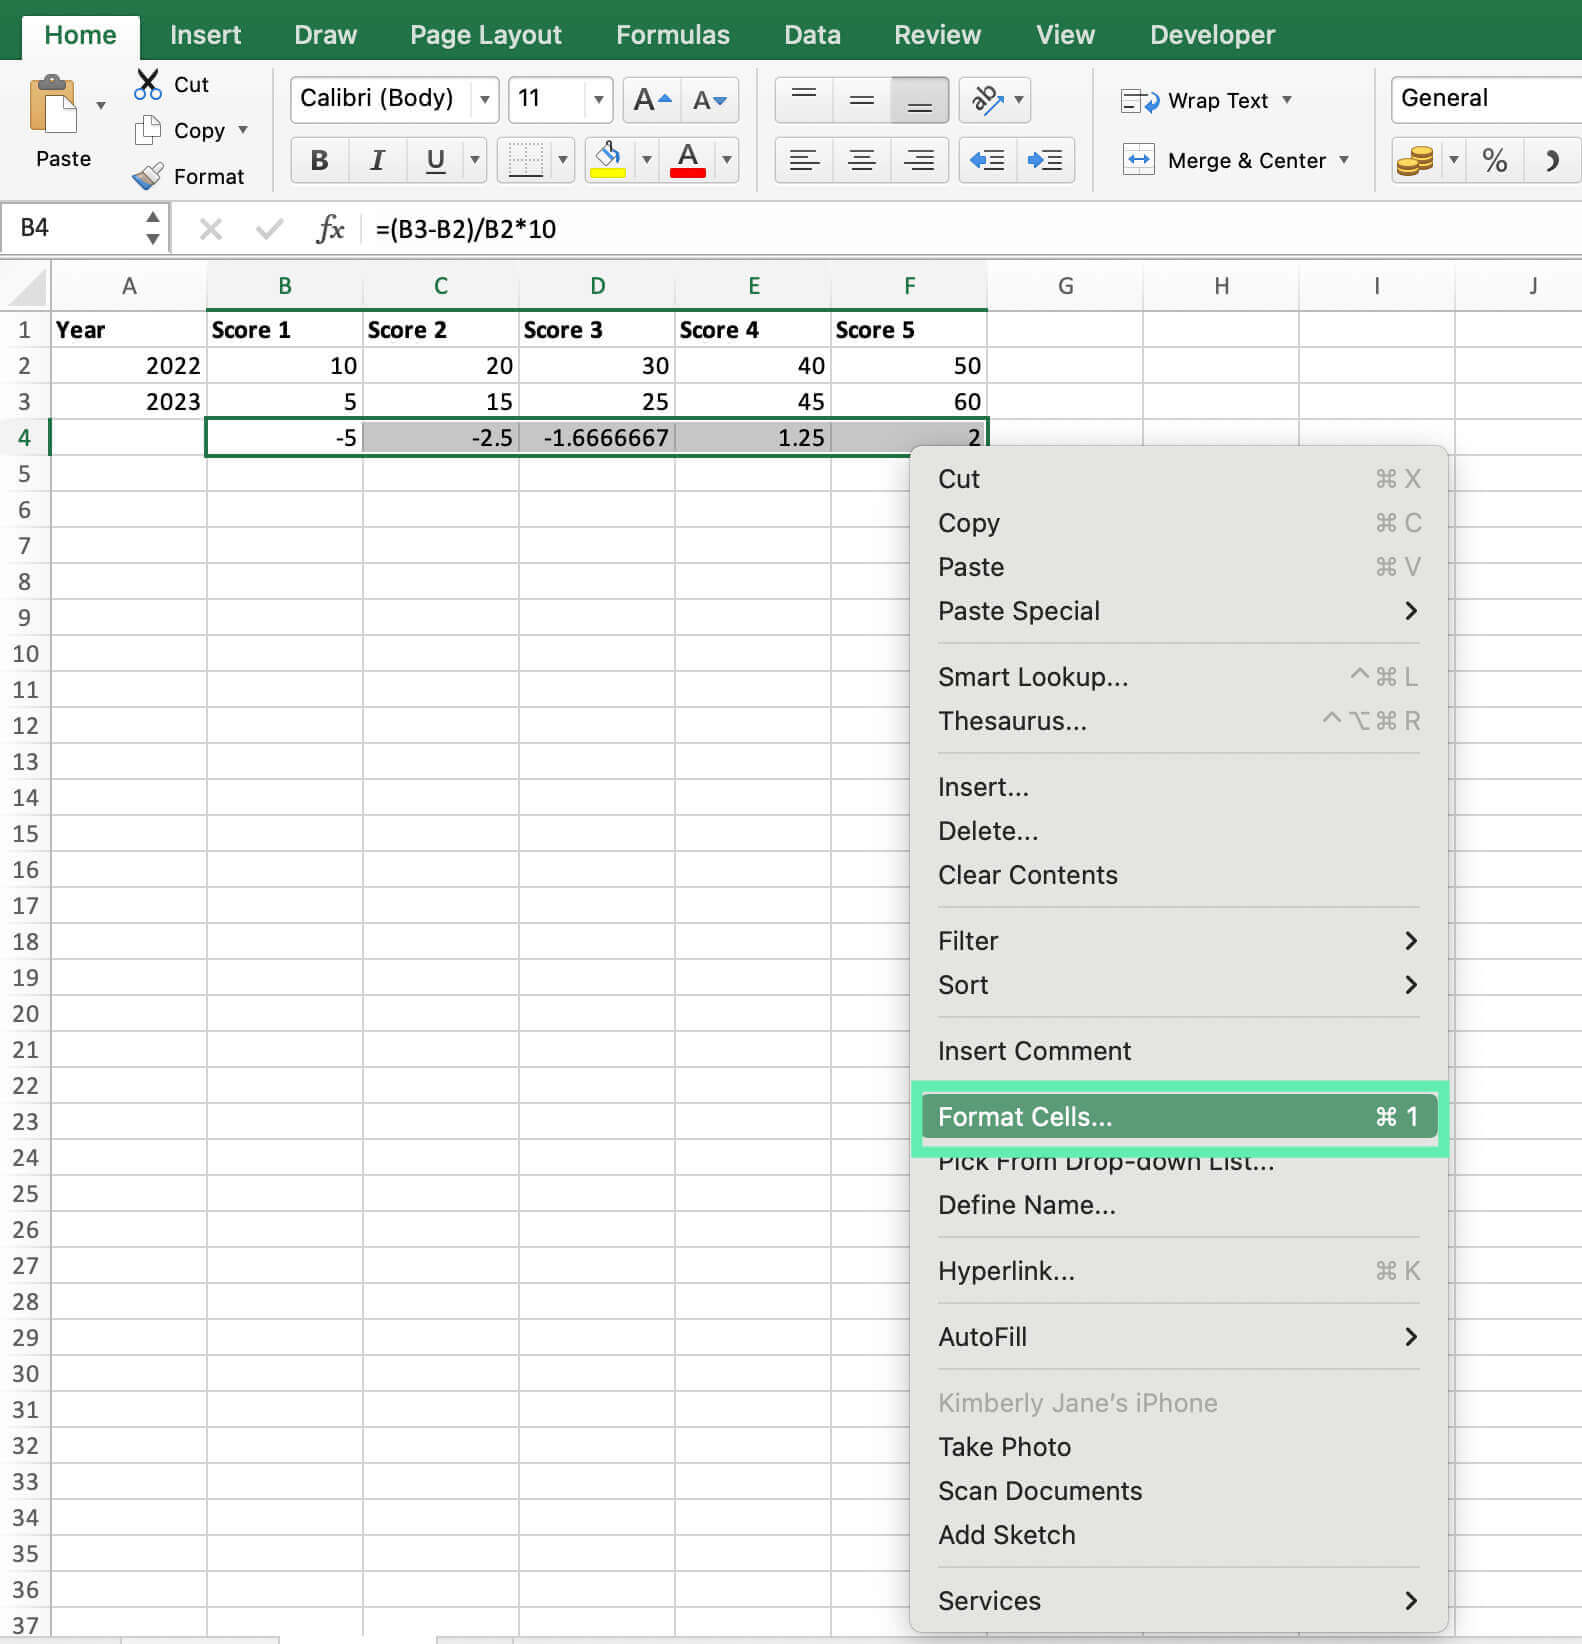
Say you conducted a customer satisfaction survey, then repeated it a year later:

To calculate the percentage change for each score:

Step 1: Set up the formula for percentage change in cell B4:

  • Type: =(B3-B2)/B2*100

Step 2: Copy the formula across to cells C4, D4, E4, and F4.

Step 3: Format the results as percentages.
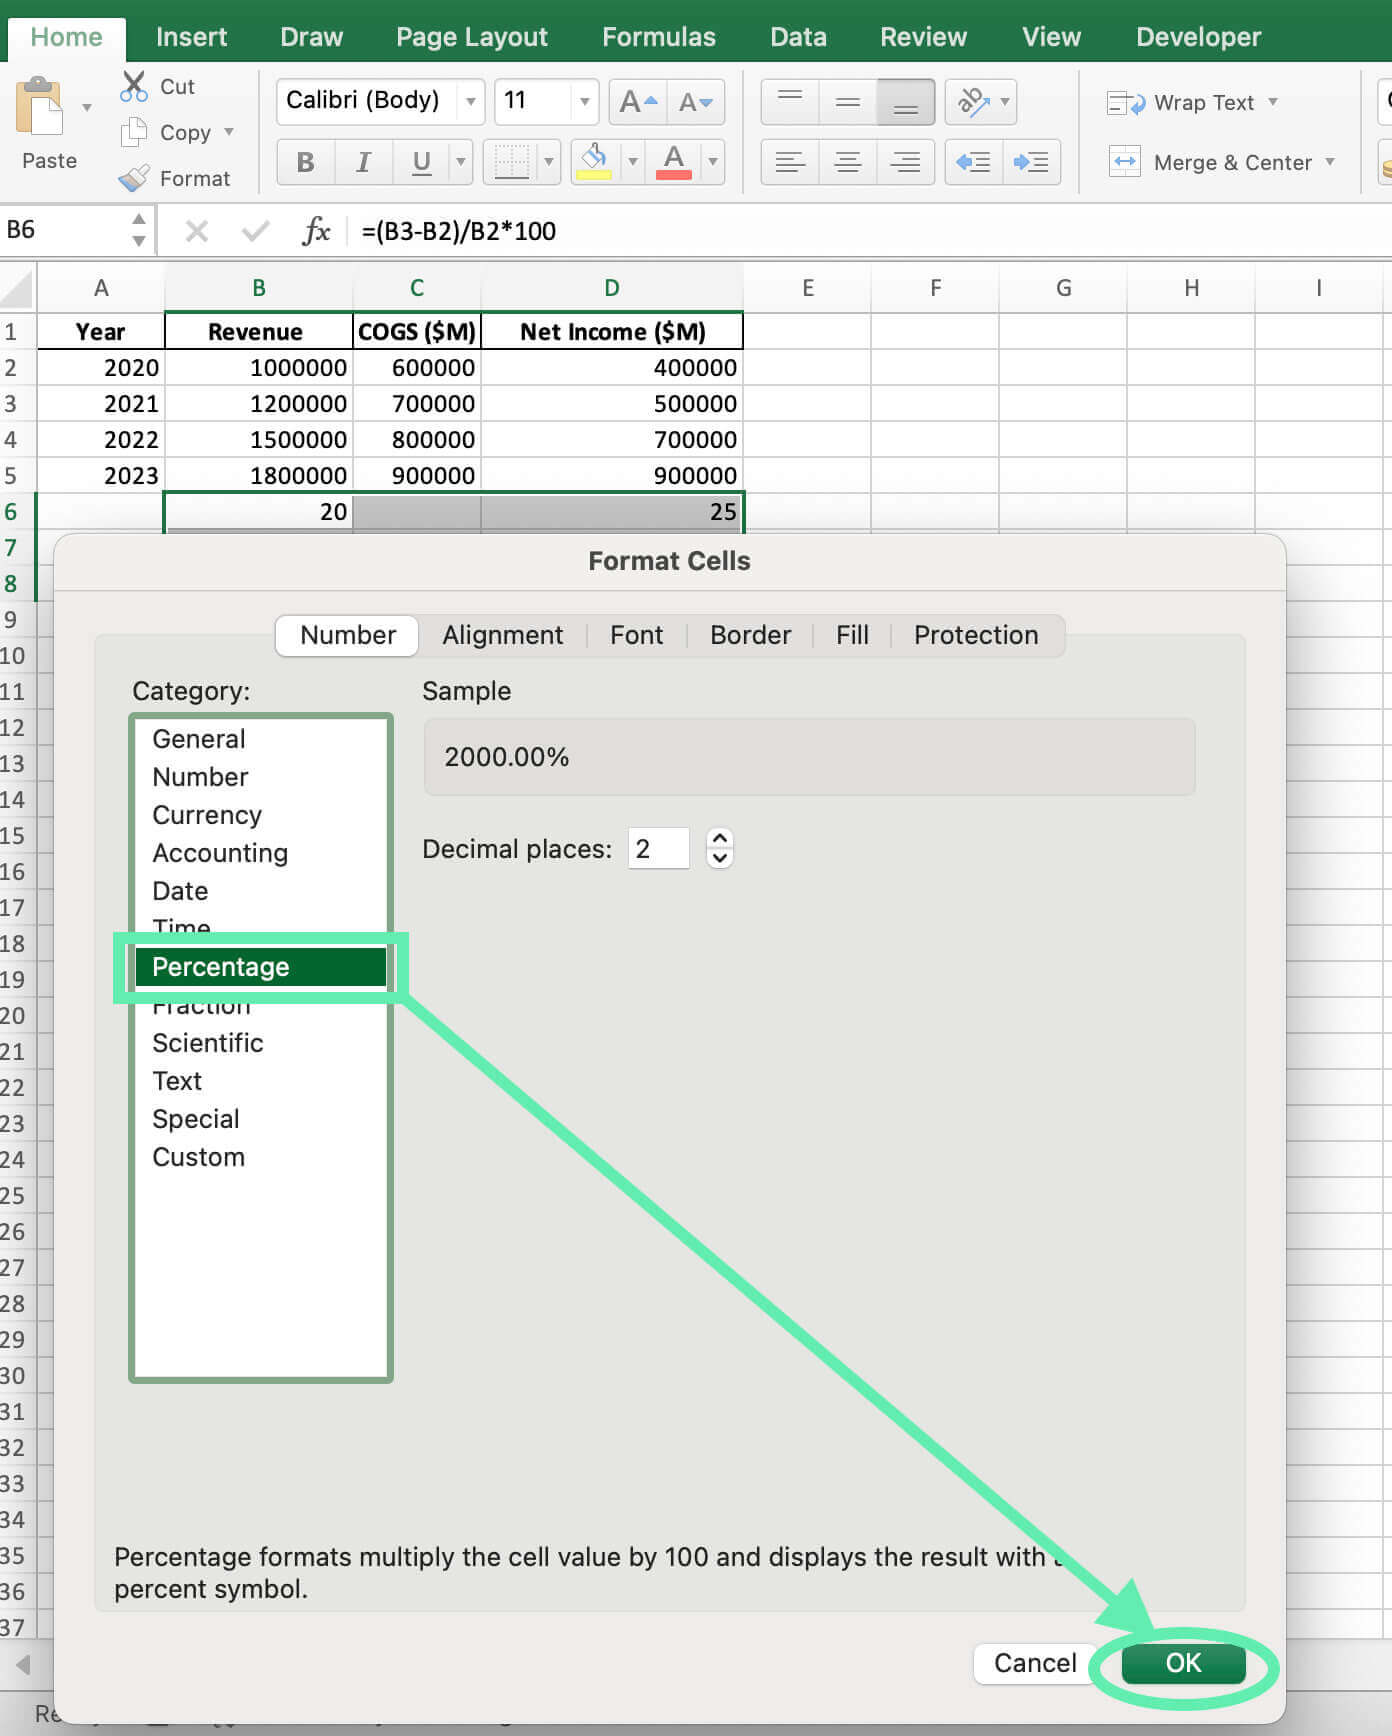
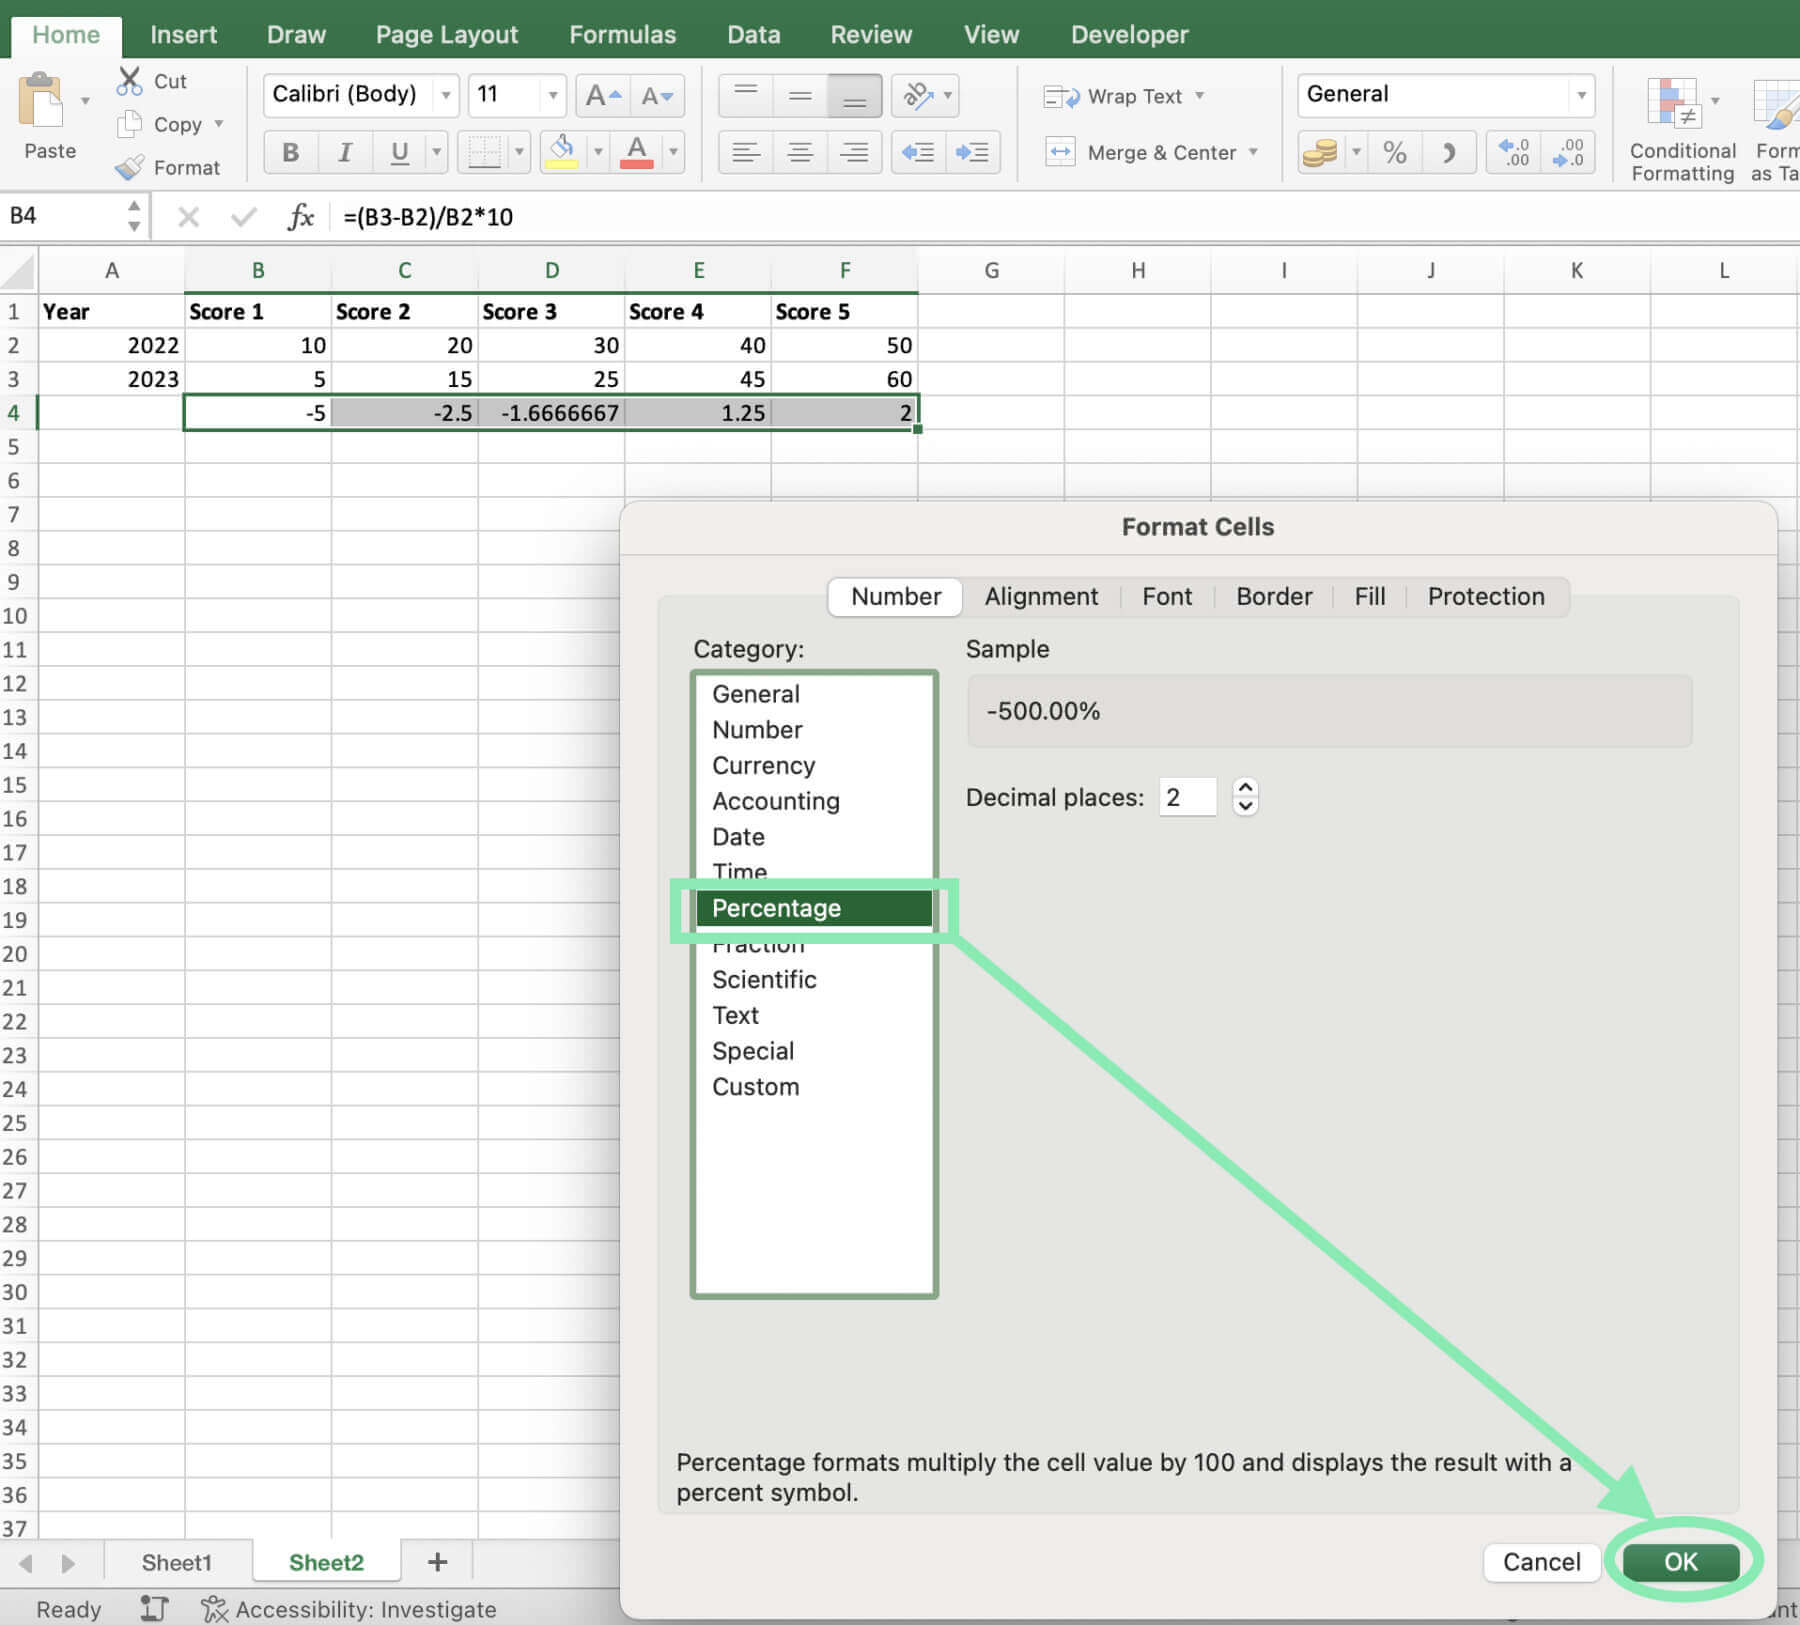
It shows how survey responses shifted, revealing changes in customer satisfaction.
Download Excel Template
Download Template

Download Template

Create Percentage Change Between Two Numbers

Try Macabacus for free to accelerate financial modeling in Excel.

Common Errors and Troubleshooting

When working with formulas in Excel, it’s common to encounter errors. Here are some tips for troubleshooting:

  • Double-check your cell references to ensure they’re correct.
  • Make sure you didn’t omit any parentheses or operators in your formula.
  • If you see a ‘DIV/0!’ error, it means you’re trying to divide by zero. Check your original value to make sure it’s not zero.
  • If you see a ‘VALUE!’ error, it means there’s a problem with the types of values being used in your formula. Make sure all your values are numbers, not text.

Advanced Tips

Once you’ve nailed the basics, try the following advanced Excel features to speed up your work:

  • Conditional formatting: Highlight cells based on values (e.g., green for positive changes, red for negative).
  • IF and VLOOKUP functions: Automate calculations based on conditions or pull data from other tables.

Conclusion

Calculating percentage change is a valuable skill for anyone working with data in Excel. By understanding the formula and how to apply it using cell references, you can quickly analyze how values change over time and make data-driven decisions.

To streamline the process of calculating percentage changes and ensure accuracy across your spreadsheets, consider using tools like Macabacus, which offers features specifically designed to enhance productivity in Excel for finance and banking professionals.

Remember to practice with different datasets to solidify your understanding of percentage change. As you become more comfortable with the concept, challenge yourself to incorporate it into more complex analyses and explore advanced Excel features to streamline your workflow.

Build Models & Decks 10x Faster with Macabacus

Gain access to 100+ shortcuts, formula auditing visualizations, easy Excel-to-PowerPoint linking, and productivity tools to build models and presentations faster than ever.

Discover more topics

Download The State of M&A Transactions
Download this report for expert guidance on innovative structures, cost-effective financing, and antitrust strategies to accelerate deals.
Read more
DCF Excel Template
Elevate your investment analysis with our free DCF model template. Understand discounted cash flow principles and perform accurate valuations in Excel.
Read more
Operating Model Excel Template
Download our free operating model Excel template. Forecast revenue, expenses, and key financial metrics for better decision-making.
Read more
LBO Excel Model
Try LBO modeling with our comprehensive Excel template. Understand key concepts, calculate returns, and gain actionable insights.
Read more