Creating Transaction Summaries
Using Pivot Tables
Pivot tables are used to summarize and analyze large amounts of data in Excel.
To create a pivot table to summarize transactions:
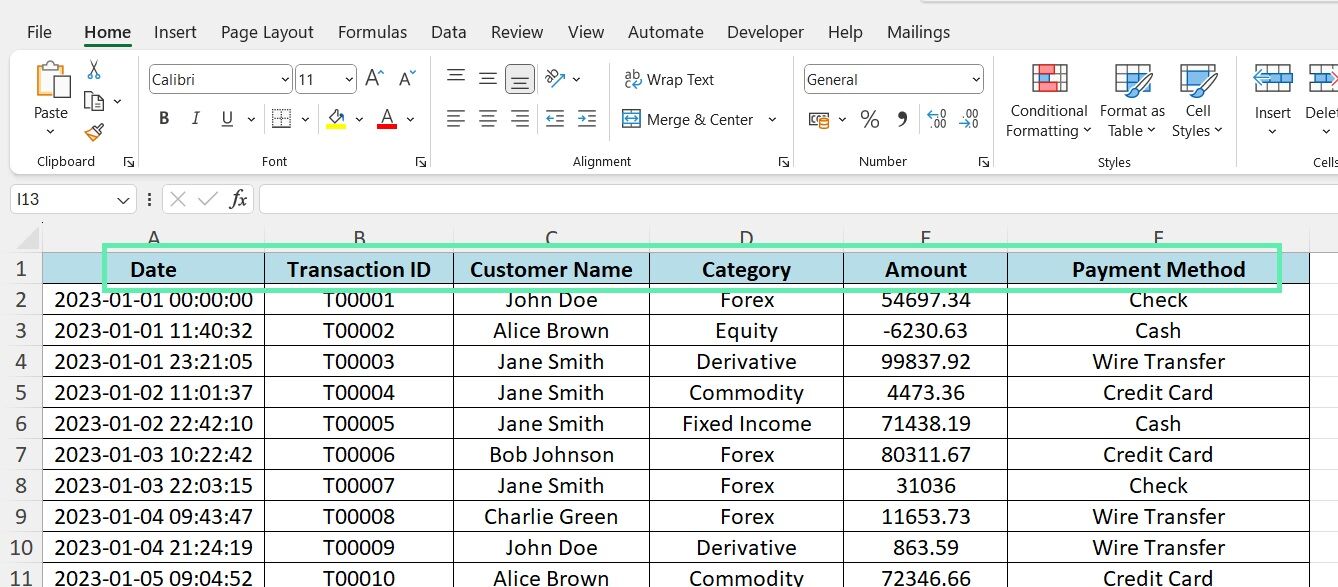
Step 1: Select the cells that contain your transaction data.
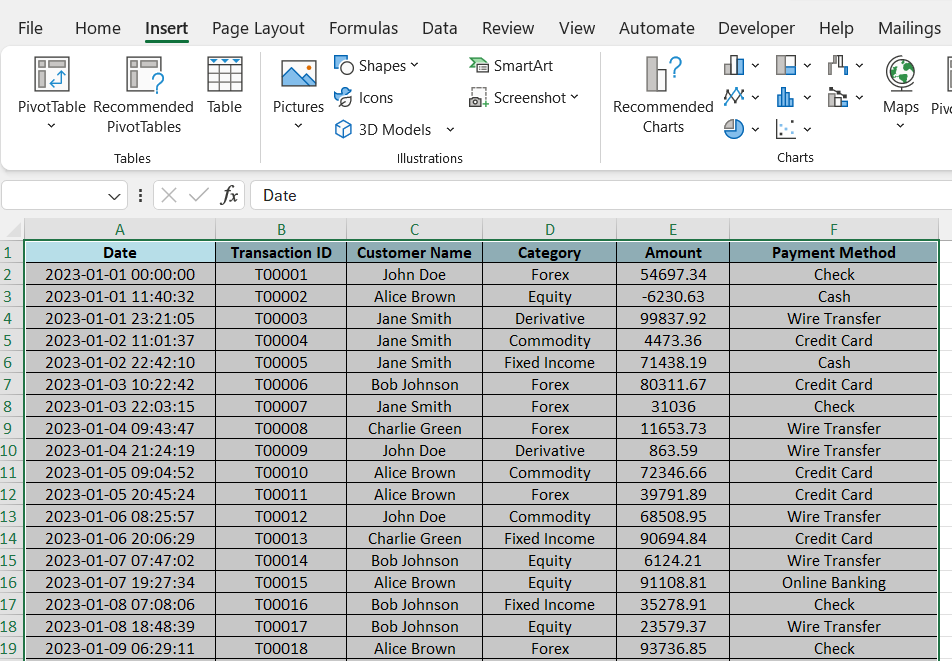
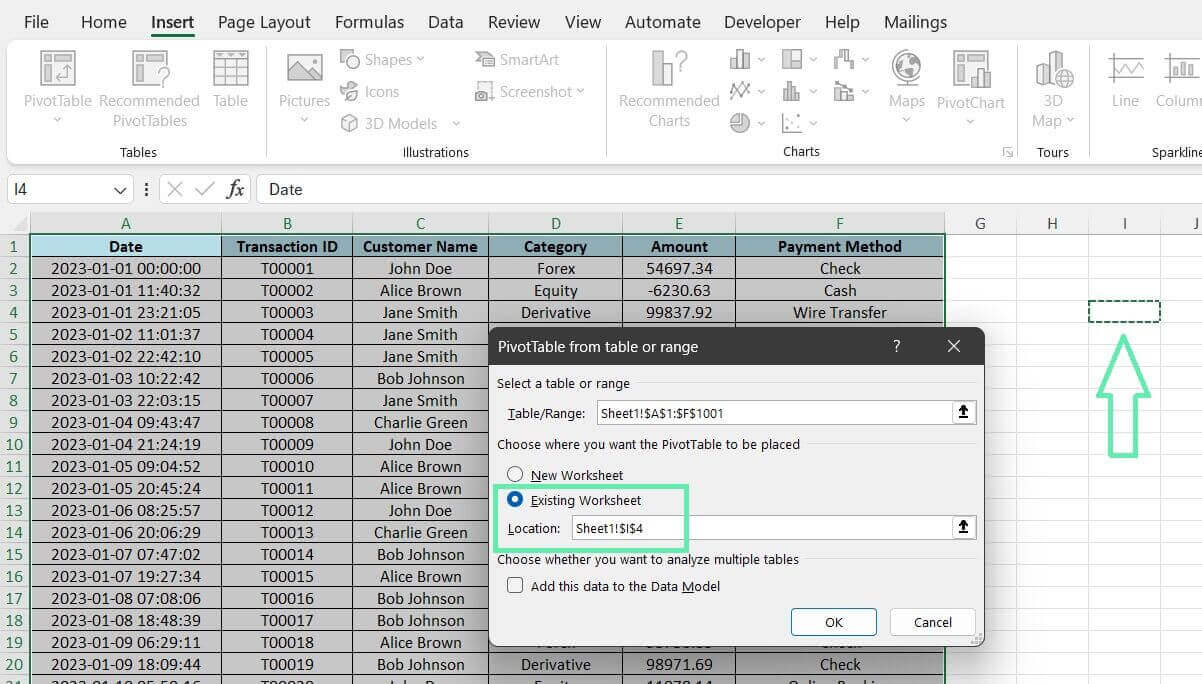
Step 2: Click the ‘Insert’ tab and choose ‘PivotTable’.
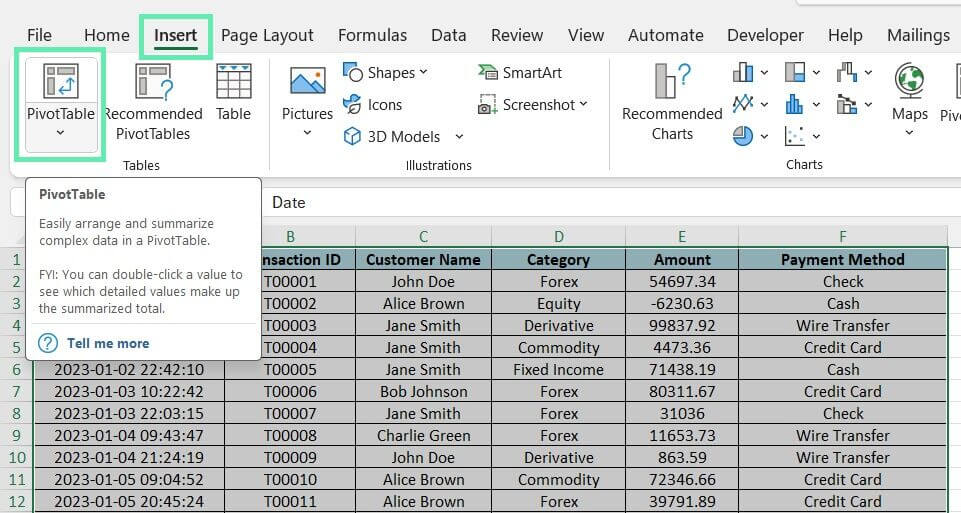
Step 3: Select the data range.
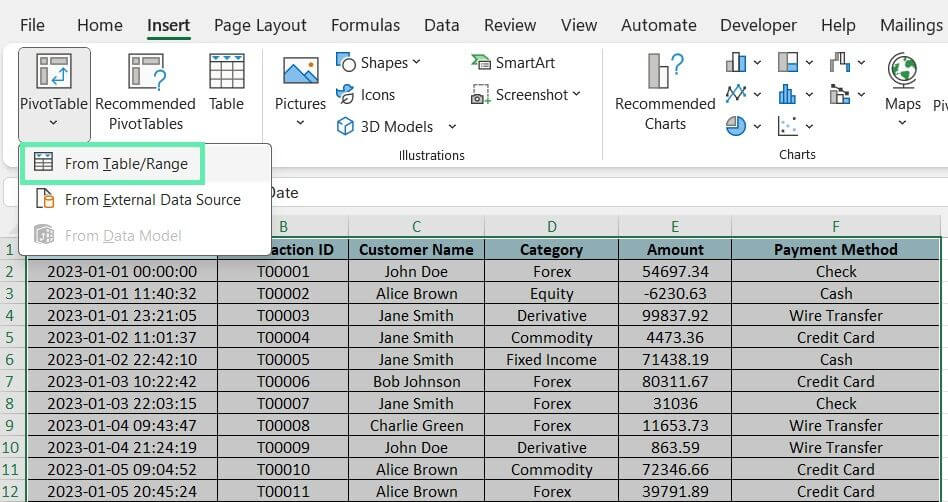
Step 4: Choose where to put the pivot table (new or existing worksheet).
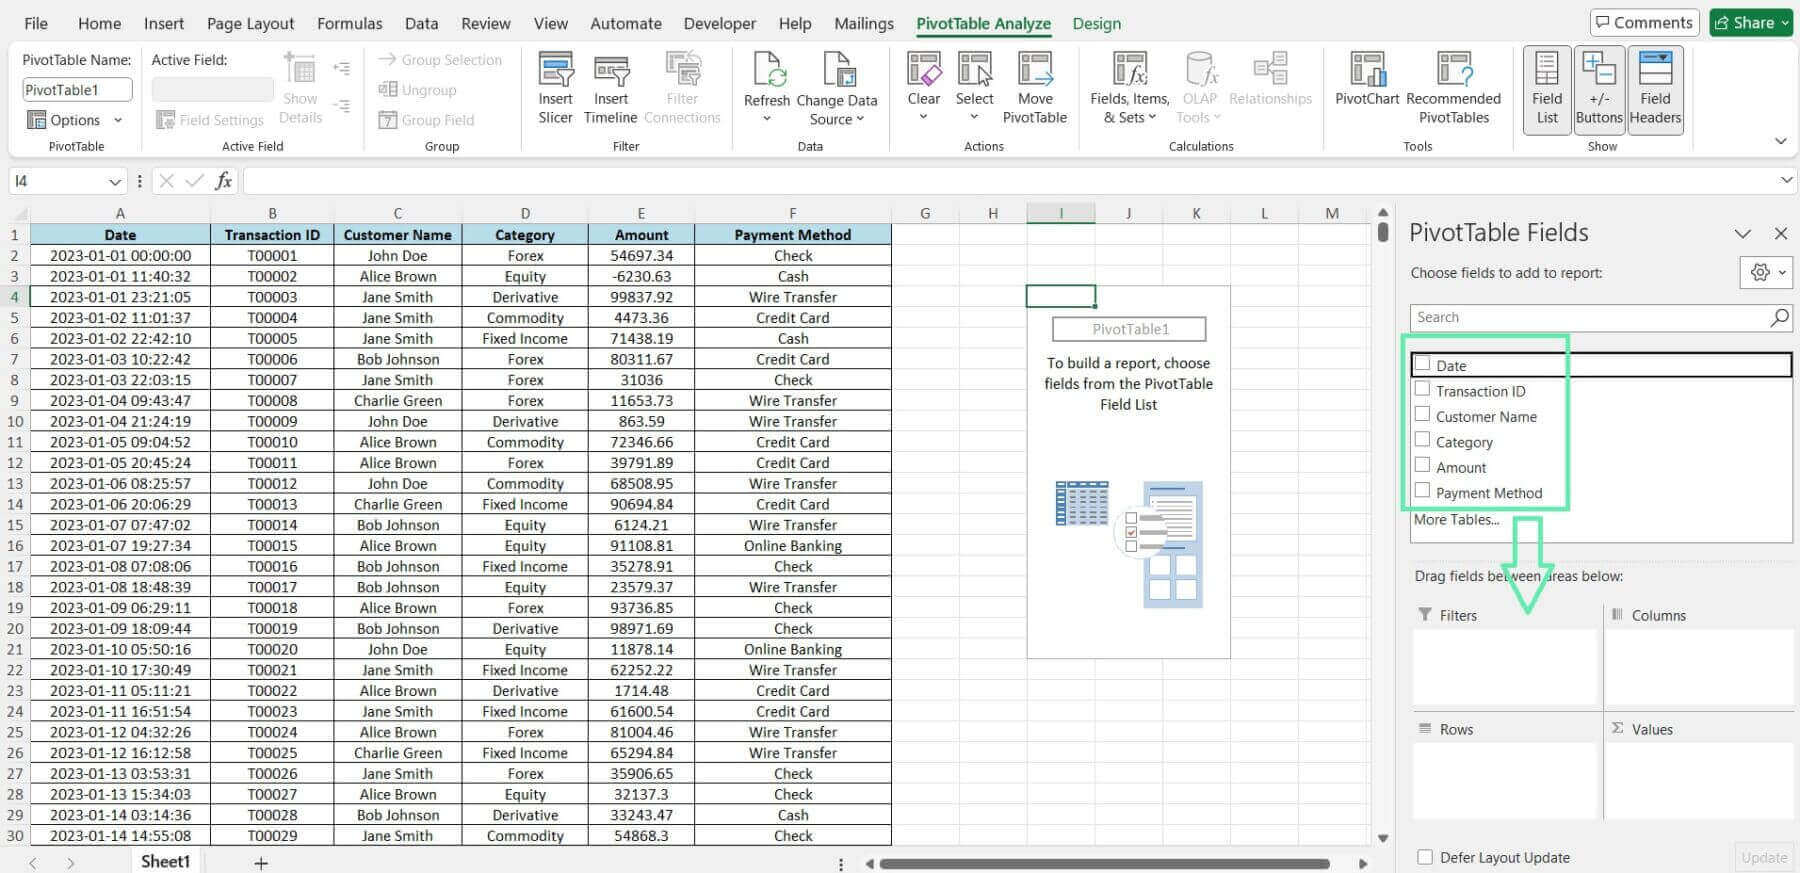
Step 5: Drag and drop the corresponding fields into the Rows, Columns, Values, and Filters areas.
Using Excel Functions
In addition to pivot tables, Excel functions can create conditional summaries of your transaction data.
Some of the most useful functions for this purpose include:
1. SUMIFS: This function allows you to sum values based on multiple criteria. The syntax is SUMIFS(sum_range, criteria_range1, criteria1, [criteria_range2, criteria2], …). To sum the transaction amounts for a specific category and date range, you could use the following formula:
=SUMIFS(E2:E10, D2:D10, “Forex”, A2:A10, “>=2023-01-01”, A2:A10, “<=2023-01-03”)
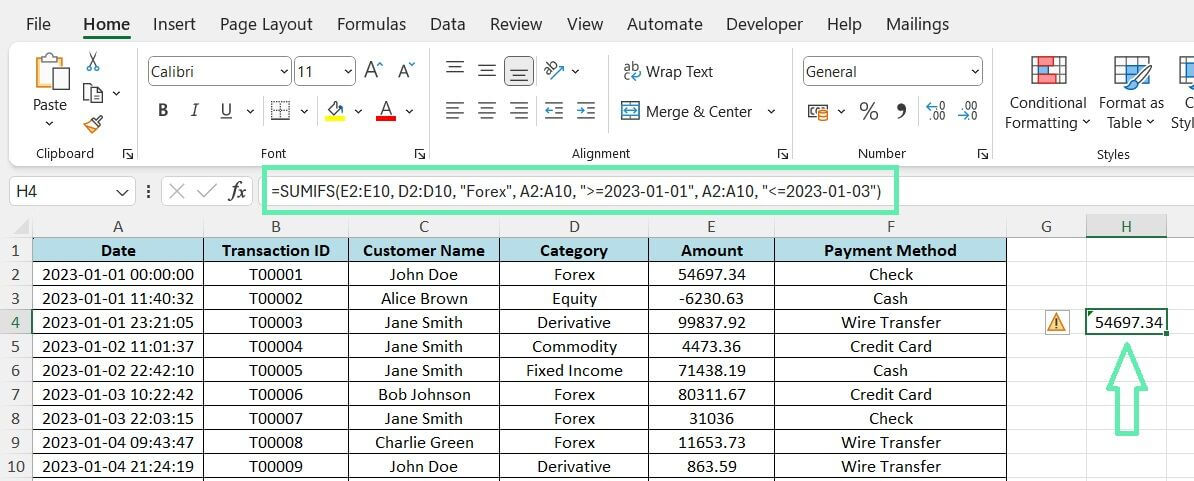
2. COUNTIFS: This function counts how many cells meet multiple criteria. The syntax is COUNTIFS(criteria_range1, criteria1, [criteria_range2, criteria2], …). To count the number of transactions for a specific customer and transaction type, use this formula:
=COUNTIFS(C2:C10, “Jane Smith”, D2:D10, “Forex”)
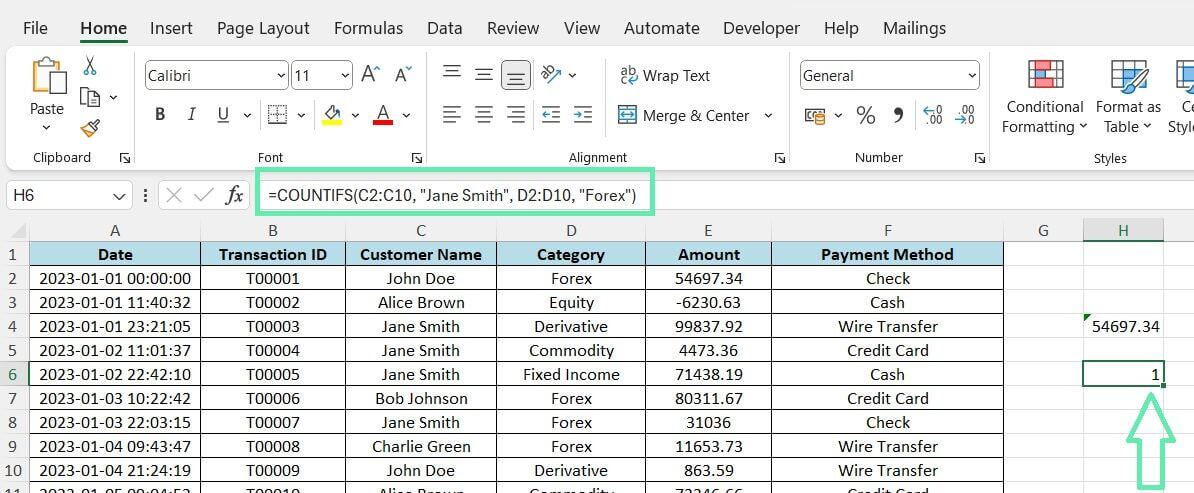
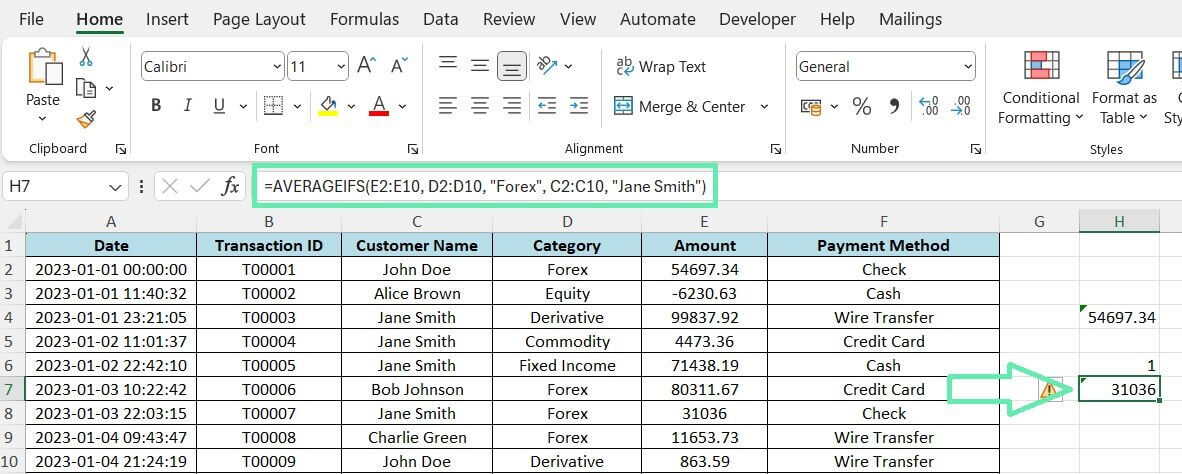
3. AVERAGEIFS: This function calculates the average of cells that meet multiple criteria. The syntax is AVERAGEIFS(average_range, criteria_range1, criteria1, [criteria_range2, criteria2], …). To find the average transaction amount for a specific category and customer name, you could use:
=AVERAGEIFS(E2:E10, D2:D10, “Forex”, C2:C10, “Jane Smith”)
Automating Transaction Summaries
Using Macros
Macros can automate repetitive tasks in Excel by recording actions and playing them back whenever needed.
To record your macro:
Step 1: Go to the ‘View’ tab and click ‘Macros’.

Step 2: Hit ‘Record Macro’.

Step 3: Name your macro and choose where to save it.
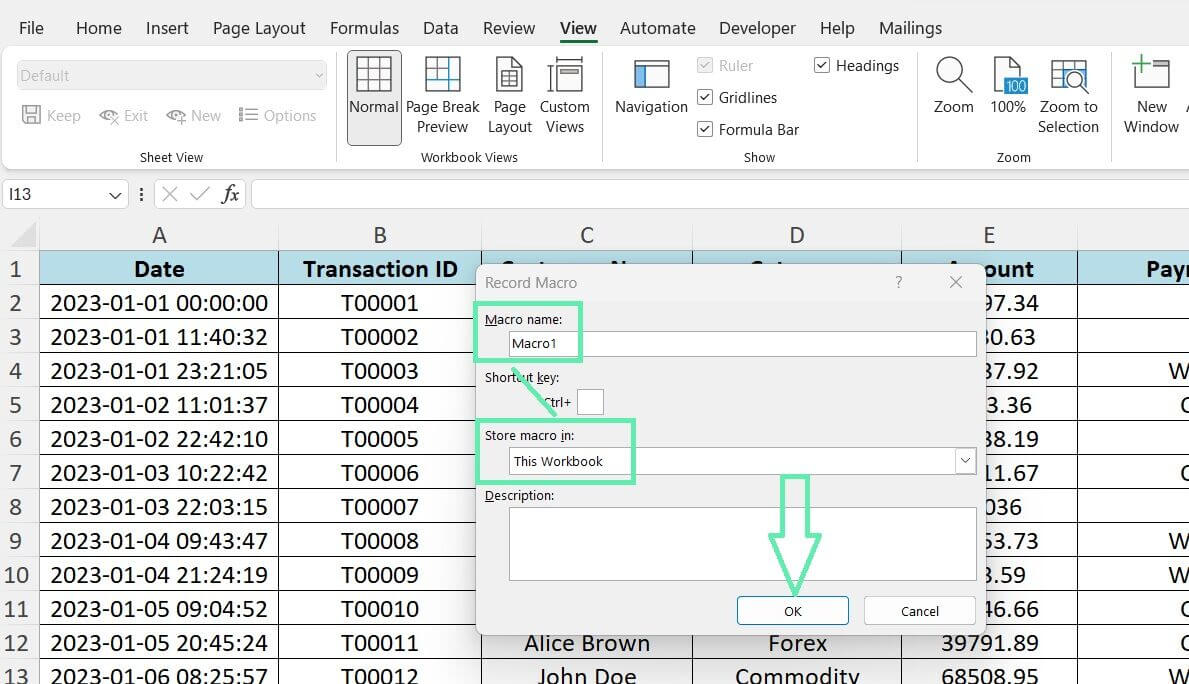
Step 4: Perform the steps you want to automate.
Step 5: Click ‘Stop Recording’ when done.

To run your macro:
Step 1: Go to the ‘View’ tab and click ‘Macros’.

Step 2: Click ‘View Macros’ and choose your macro from the list.
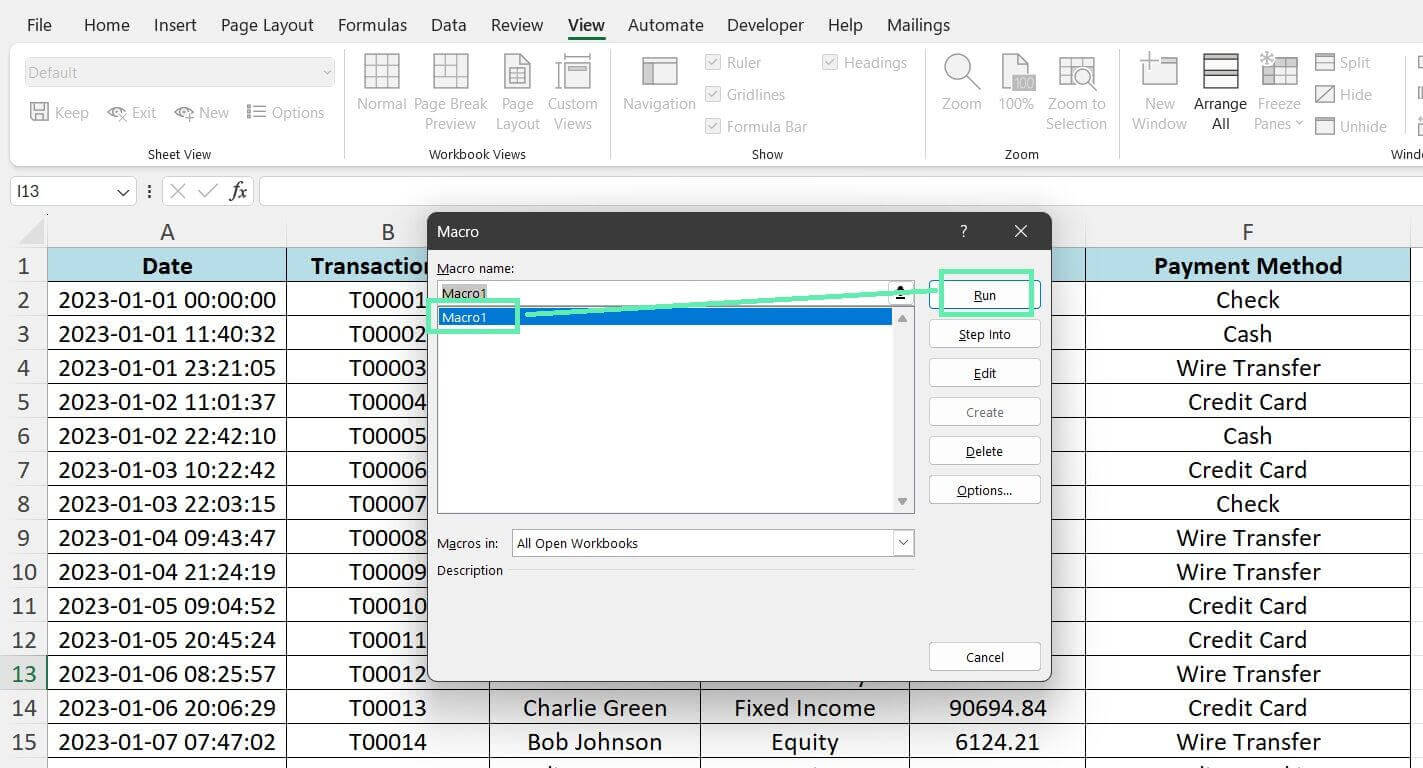
Step 3: Click ‘Run’.
Using VBA for Custom Automation
VBA (Visual Basic for Applications) is used to write custom scripts for more advanced automation. With VBA, you can create more complex and flexible automations.
To use VBA:
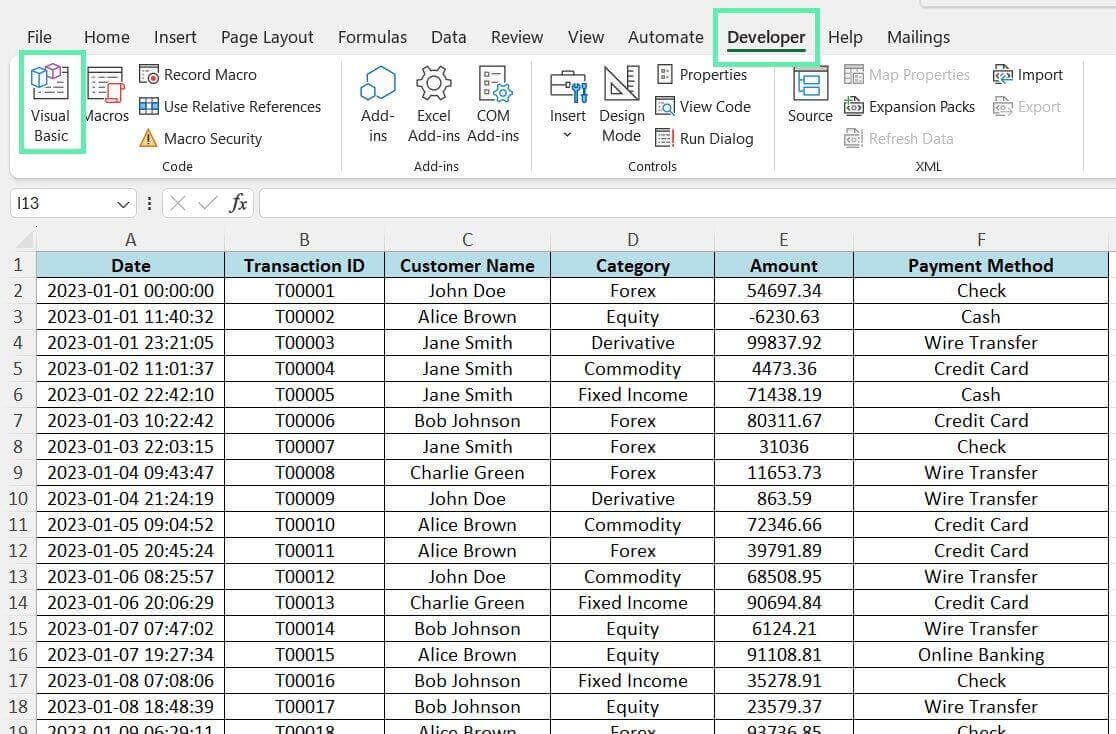
Step 1: Open the VBA by clicking ‘Alt+F11′ or click on the ‘Developer’ tab and choose ‘Visual Basic’.
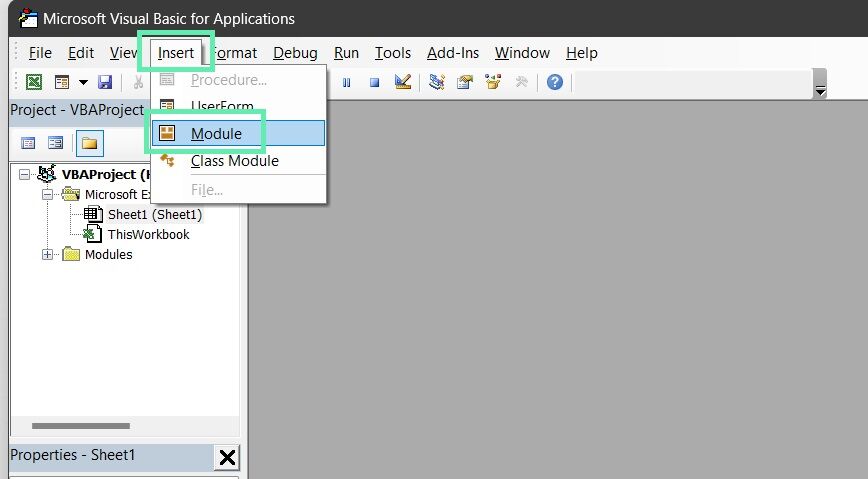
Step 2: From the Visual Basic Editor, click ‘Insert’ and then select ‘Module’.
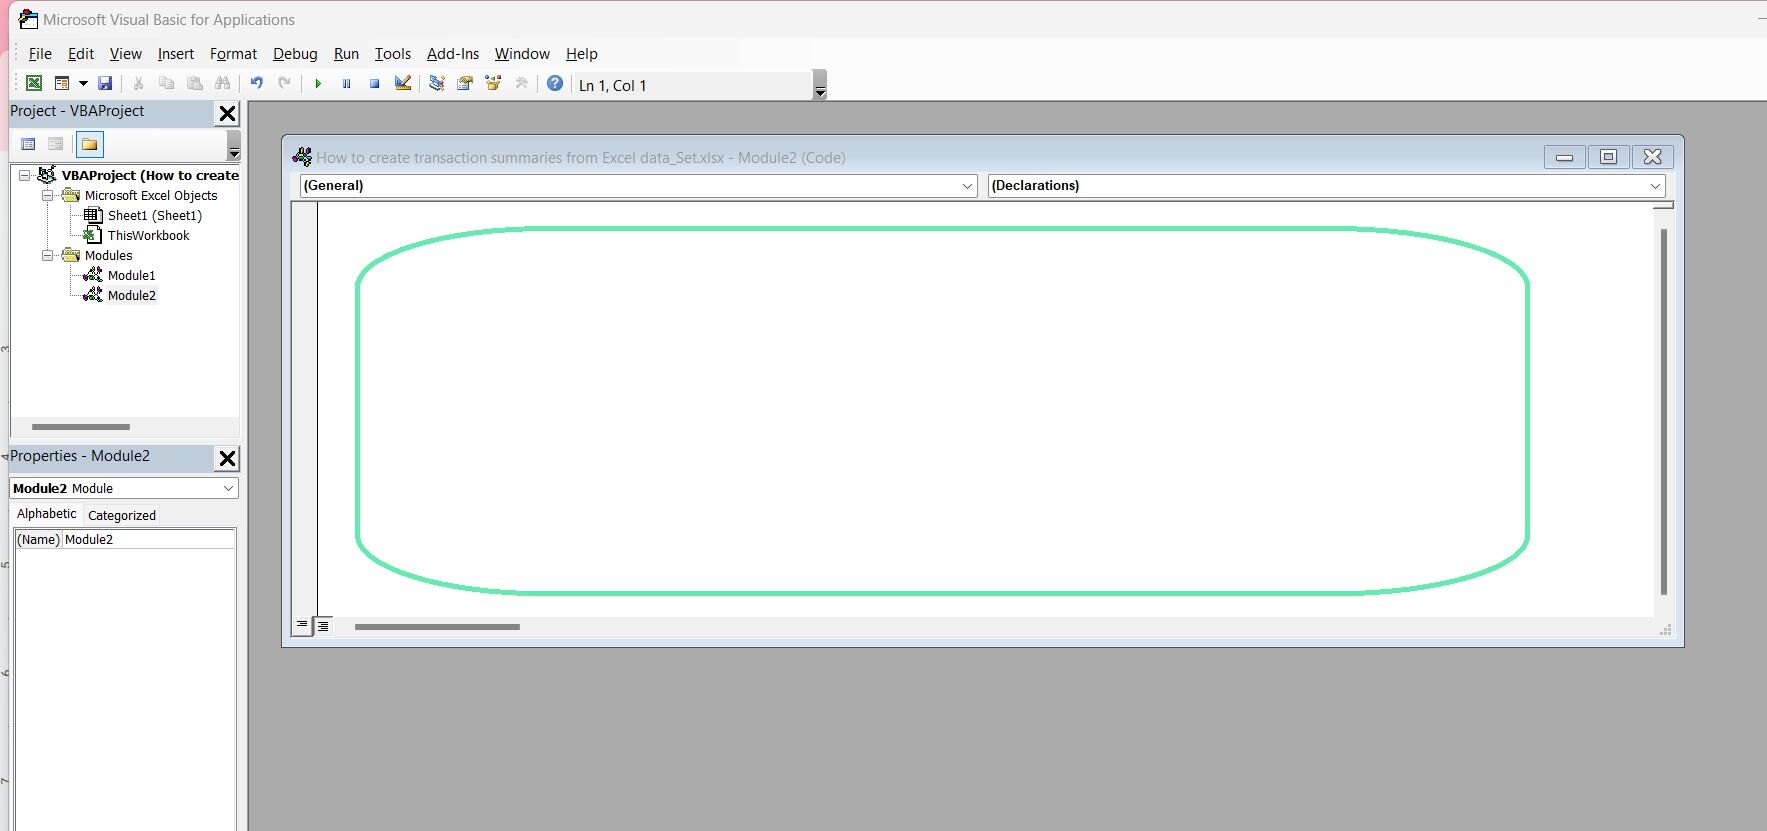
Step 3: Write your VBA script in the module. You could write a script to prompt the user to select a range of data, create a pivot table based on that data, and apply custom formatting.
Visualizing Transaction Summaries
Creating Charts and Graphs
With Charts and graphs, you can visualize your transaction summaries and identify trends or patterns in your data.
To create charts in Excel:
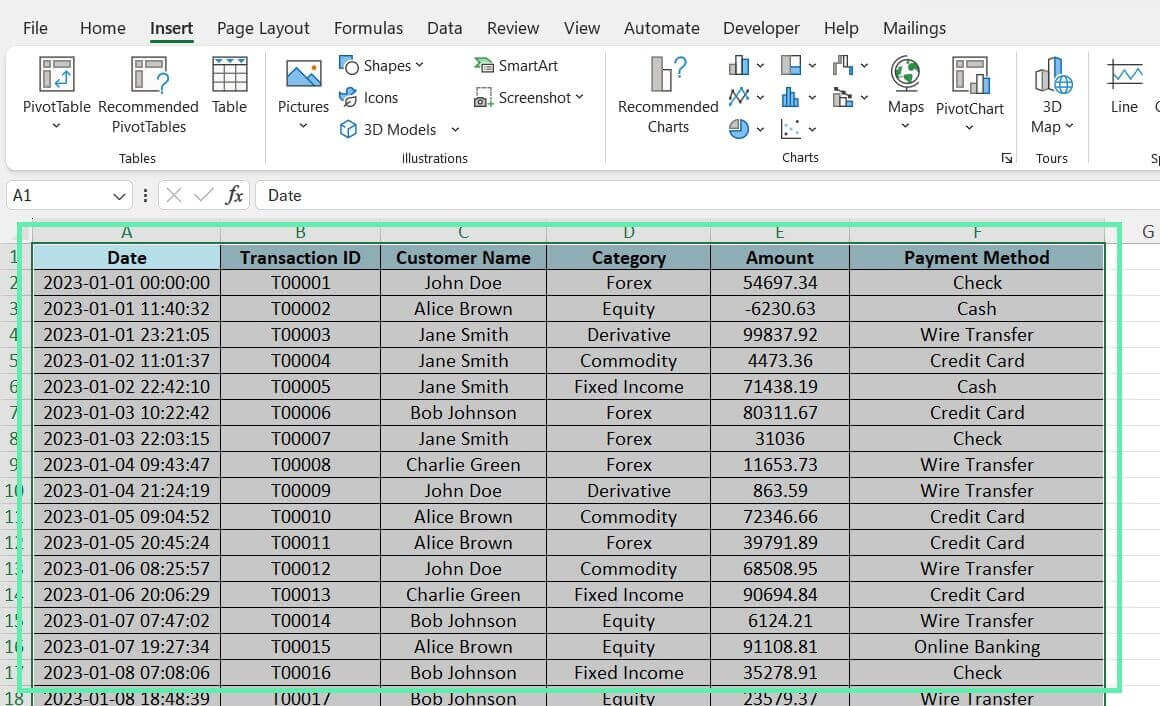
Step 1: Select the data you want to visualize, including the headers.
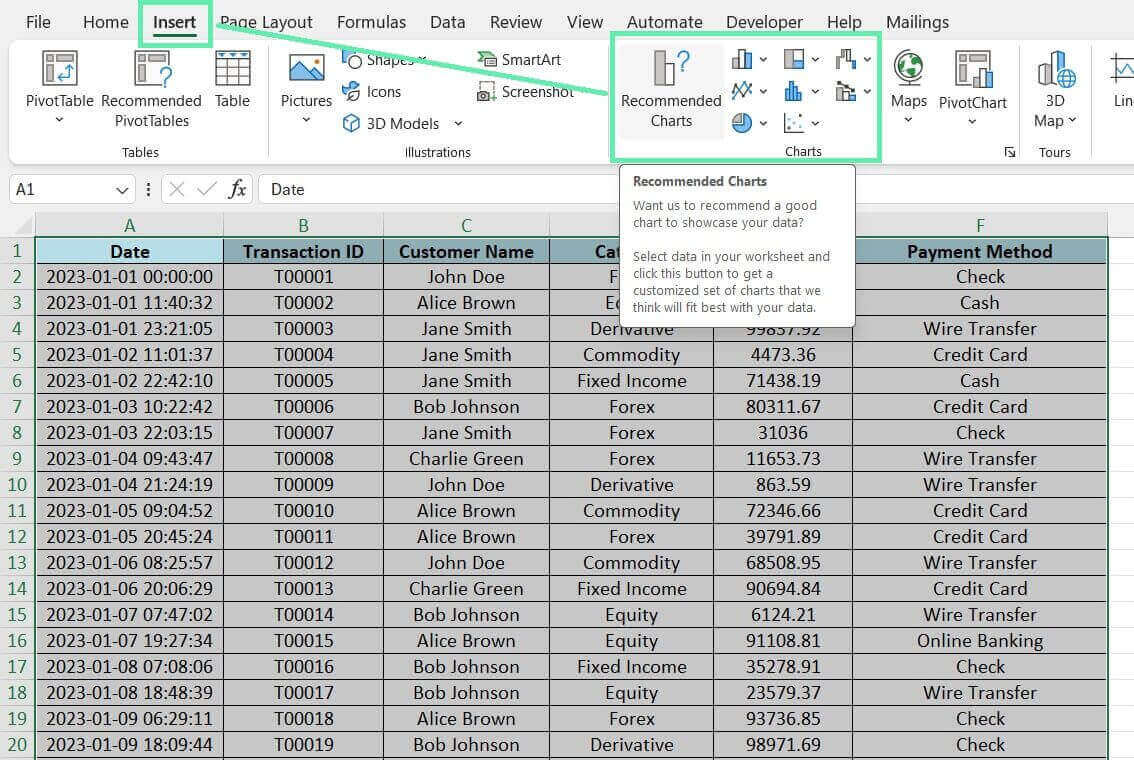
Step 2: Click on the ‘Insert’ tab and choose the type of chart you want to create.
Step 3: Customize your chart by adjusting the layout, style, and formatting options.
Tips for choosing the right chart type:
- Use column or bar charts to compare values across categories
- Line charts can be used to show trends over time
- Use pie charts to show the composition of a whole
Using Excel’s Dashboard Features
Dashboards are visual representations of data that combine charts, tables, and summaries into a single interactive view. To create a simple transaction summary dashboard, make your summary components on separate worksheets, such as pivot tables and charts. Next, add a new worksheet dedicated to your dashboard.
Use Excel’s camera tool, found on the ‘View’ tab, to create linked pictures of your summary components and place them on the dashboard sheet. Arrange and resize these components to achieve a clean and organized layout.
Finally, enhance your dashboard by adding interactive elements like slicers or drop-down lists, allowing users to filter the data dynamically and gain deeper insights.
Best Practices and Tips
Maintaining Accuracy
It’s important to update your data regularly and verify your results regularly to ensure the accuracy of your transaction summaries.
Tips to maintain accuracy:
- Regularly refresh your data sources to include the latest transactions.
- Double-check your formulas and calculations to ensure they are correct.
- Use data validation techniques to catch errors or inconsistencies in your data.
- To verify their accuracy, compare your summaries to other reports or data sources.
Enhancing Readability and Usability
In addition to accuracy, it’s important to ensure that your transaction summaries are easy to read and use.
Tips to enhance the readability and usability of your summaries:
- Use clear and concise labels for rows, columns, and data points.
- Apply consistent formatting (e.g., fonts, colors, borders) to make your summaries visually appealing and easy to navigate.
- Emphasize crucial data points or trends using conditional formatting.
- Provide documentation or instructions to help users understand and interpret your summaries.
Conclusion
Investment bankers must create effective transaction summaries. One tool that can effectively help them do so is Microsoft Excel. Excel can transform raw data into reports and visualizations to identify trends, opportunities, and risks.
In this blog post, we cover the essential steps for creating transaction summaries in Excel, from organizing and cleaning data to creating advanced reports and implementing automation. Mastering the said techniques will help you handle complex transaction datasets and uncover valuable insights. As you apply your newly acquired skills in your work, remember to continually explore and experiment with Excel’s vast features and functionalities.
Consider using Macabacus to enhance your Excel work. It streamlines tasks and provides reliable links between Excel, PowerPoint, and Word, saving time and ensuring document consistency. With Macabacus, you can boost your efficiency and effectiveness as an investment banker. Always stay curious, proactive, and diligent in your approach to transaction summaries!

