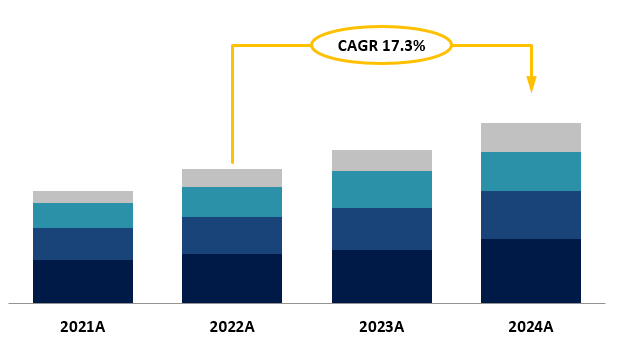
Visualise Data Trends with Macabacus’ Enhanced Growth Arrow

Growth Arrows are an essential visualization tool for finance and banking professionals because they provide a clear, visual representation of trends and changes over time. By helping simplify complex data and enhancing visual clarity, Growth Arrows are a great way to represent data points such as Compound Annual Growth Rate (CAGR), year-over-year growth, quarterly or monthly terms, and much more. 

In the latest version* of Macabacus, we’ve made further improvements to the Growth Arrow functionality, making it easier and more flexible to use than ever before.

*Requires Macabacus version 9.7.2 or newer – Download today to stay up to date!


Build Models & Decks 10x Faster with Macabacus

Gain access to 100+ shortcuts, formula auditing visualizations, easy Excel-to-PowerPoint linking, and productivity tools to build models and presentations faster than ever.

What makes Macabacus’ Growth Arrows better than other solutions?

Macabacus’ Growth Arrows adjust dynamically as your data, which gives you a significant advantage over other solutions that often require you to build Growth Arrows as static shapes, resulting in a time-consuming and inflexible process.

Several new features have been added in the latest version of Macabacus to further improve Growth Arrows*:

Streamlined, Intuitive UI

A redesigned interface that makes it easier than ever to add and customize growth arrows in your stacked or clustered column charts.

Full Control Over Start and End Periods

Specify the start and end periods for your growth arrow, giving you more flexibility to represent your data appropriately.

Dynamic, Formula-Driven Arrows

Unlike tools that hard-code static shapes, we insert arrows as dynamic data series. This method ensures that your charts update automatically with any changes to your data, keeping your visuals current, impactful, and easy to update.

Compatible with non-Macabacus users

Macabacus’ Growth Arrows are built using native Excel functionality – this means you can share your work with non-Macabacus users of Excel without the nagging risk of compatibility issues.

Conclusion

The updated Growth Arrow tool in Macabacus* helps you create smarter, more dynamic visuals that adapt as your data changes, saving you time and enhancing the clarity of your insights. Whether you’re analyzing historical trends or forecasting future growth, Macabacus’ Growth Arrows offer the precision, ease, and flexibility you need to create visually appealing and impactful charts. 

Your data visualization just got easier—and more powerful.

*Requires Macabacus version 9.7.2 or newer – Download today to stay up to date!

Build Models & Decks 10x Faster with Macabacus

Gain access to 100+ shortcuts, formula auditing visualizations, easy Excel-to-PowerPoint linking, and productivity tools to build models and presentations faster than ever.

Discover more topics

Download The State of M&A Transactions
Download this report for expert guidance on innovative structures, cost-effective financing, and antitrust strategies to accelerate deals.
Read more
DCF Excel Template
Elevate your investment analysis with our free DCF model template. Understand discounted cash flow principles and perform accurate valuations in Excel.
Read more
Operating Model Excel Template
Download our free operating model Excel template. Forecast revenue, expenses, and key financial metrics for better decision-making.
Read more
LBO Excel Model
Try LBO modeling with our comprehensive Excel template. Understand key concepts, calculate returns, and gain actionable insights.
Read more