How to Find and Remove Blank Rows in Excel

How to Find and Remove Blank Rows in Excel

In investment banking, data integrity is crucial because it determines the success or failure of a transaction. Investment bankers work with large amounts of data from different sources to perform financial analysis, create valuation models, and prepare client presentations.

Frequently, blank rows appear in spreadsheets due to consolidation issues or input mistakes. Failure to eliminate such empty rows affects accuracy while slowing down financial modeling processes. This article shows how you can identify and delete blank lines in Excel using live investment bank dataset examples step by step.


Understanding Blank Rows in Excel

Before we dive into the methods of managing blank rows, let’s define what a blank row is. A blank row can be either a completely empty row or a row with some missing data. In the context of investment banking, a row might be considered blank if it’s missing crucial financial metrics like revenue, EBITDA, or market capitalization.

The presence of blank rows can significantly impact financial analysis. They can affect data sorting and filtering, leading to incorrect calculations and skewed results. In valuation models, blank rows can cause errors in formulas and lead to misrepresentation of a company’s financial health. Therefore, it’s essential for investment bankers to identify and remove blank rows to maintain data integrity and ensure accurate financial analysis.

Create Financial Models 10x Faster with Macabacus

Gain access to 100+ shortcuts, formula auditing visualizations, easy Excel-to-PowerPoint linking and productivity tools to help you accelerate financial modeling and presentations.

Preparing Your Excel Data

Before making any modifications to your Excel data, it’s crucial to create a backup. It safeguards your original data in case of any unintended changes or deletions during the blank row removal process.

For the purpose of this guide, we’ll be using a mock investment banking dataset that includes common financial metrics such as revenue, EBITDA, and market cap. The dataset will serve as a practical example to demonstrate the various methods of identifying and removing blank rows.

Download Excel Template

Download Template

Download Template

Find and Remove Blank Rows

Try Macabacus for free to accelerate financial modeling in Excel.

How to Identify Blank Rows in Excel

Here are the different ways to identify blank rows in Excel:

Method 1: Using Excel Filter to Highlight Blank Rows

Step 1: Select the entire dataset by clicking on the top-left corner of your data range or using the shortcut ‘Ctrl + A’.
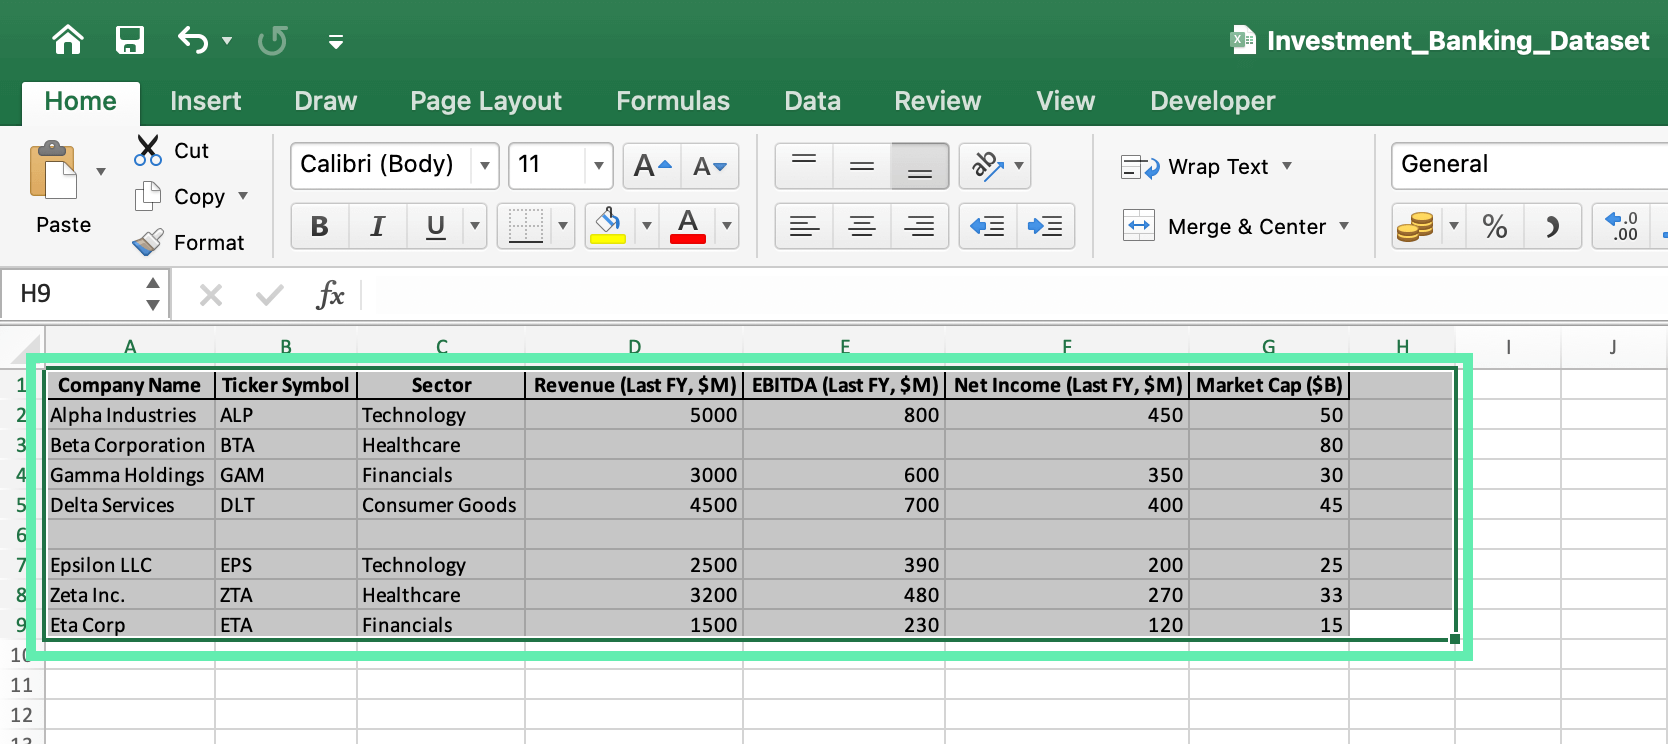
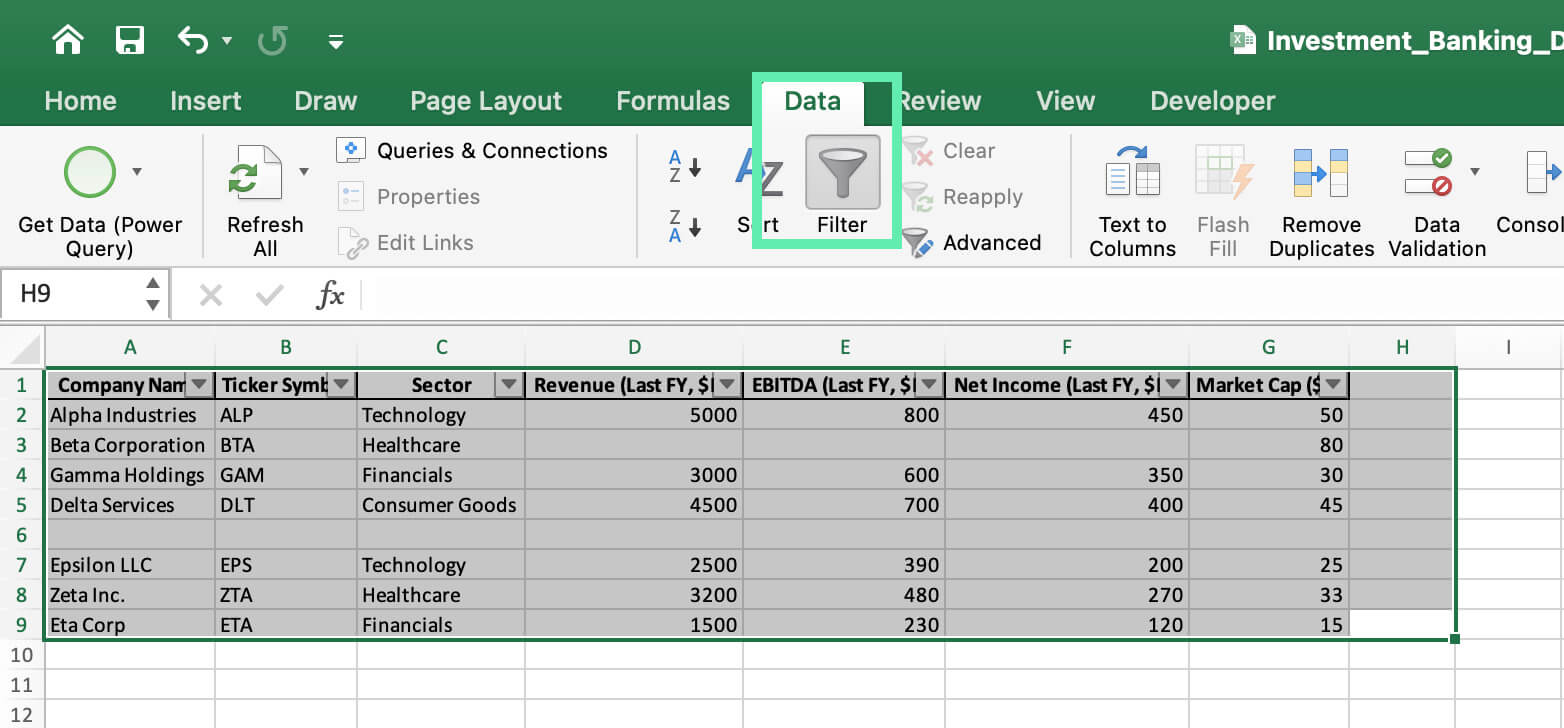
Step 2: Go to the ‘Data’ tab in the Excel ribbon and click on ‘Filter’.
Step 3: Click on the filter arrow for each column and select ‘Blanks’ to highlight the blank rows in that column.
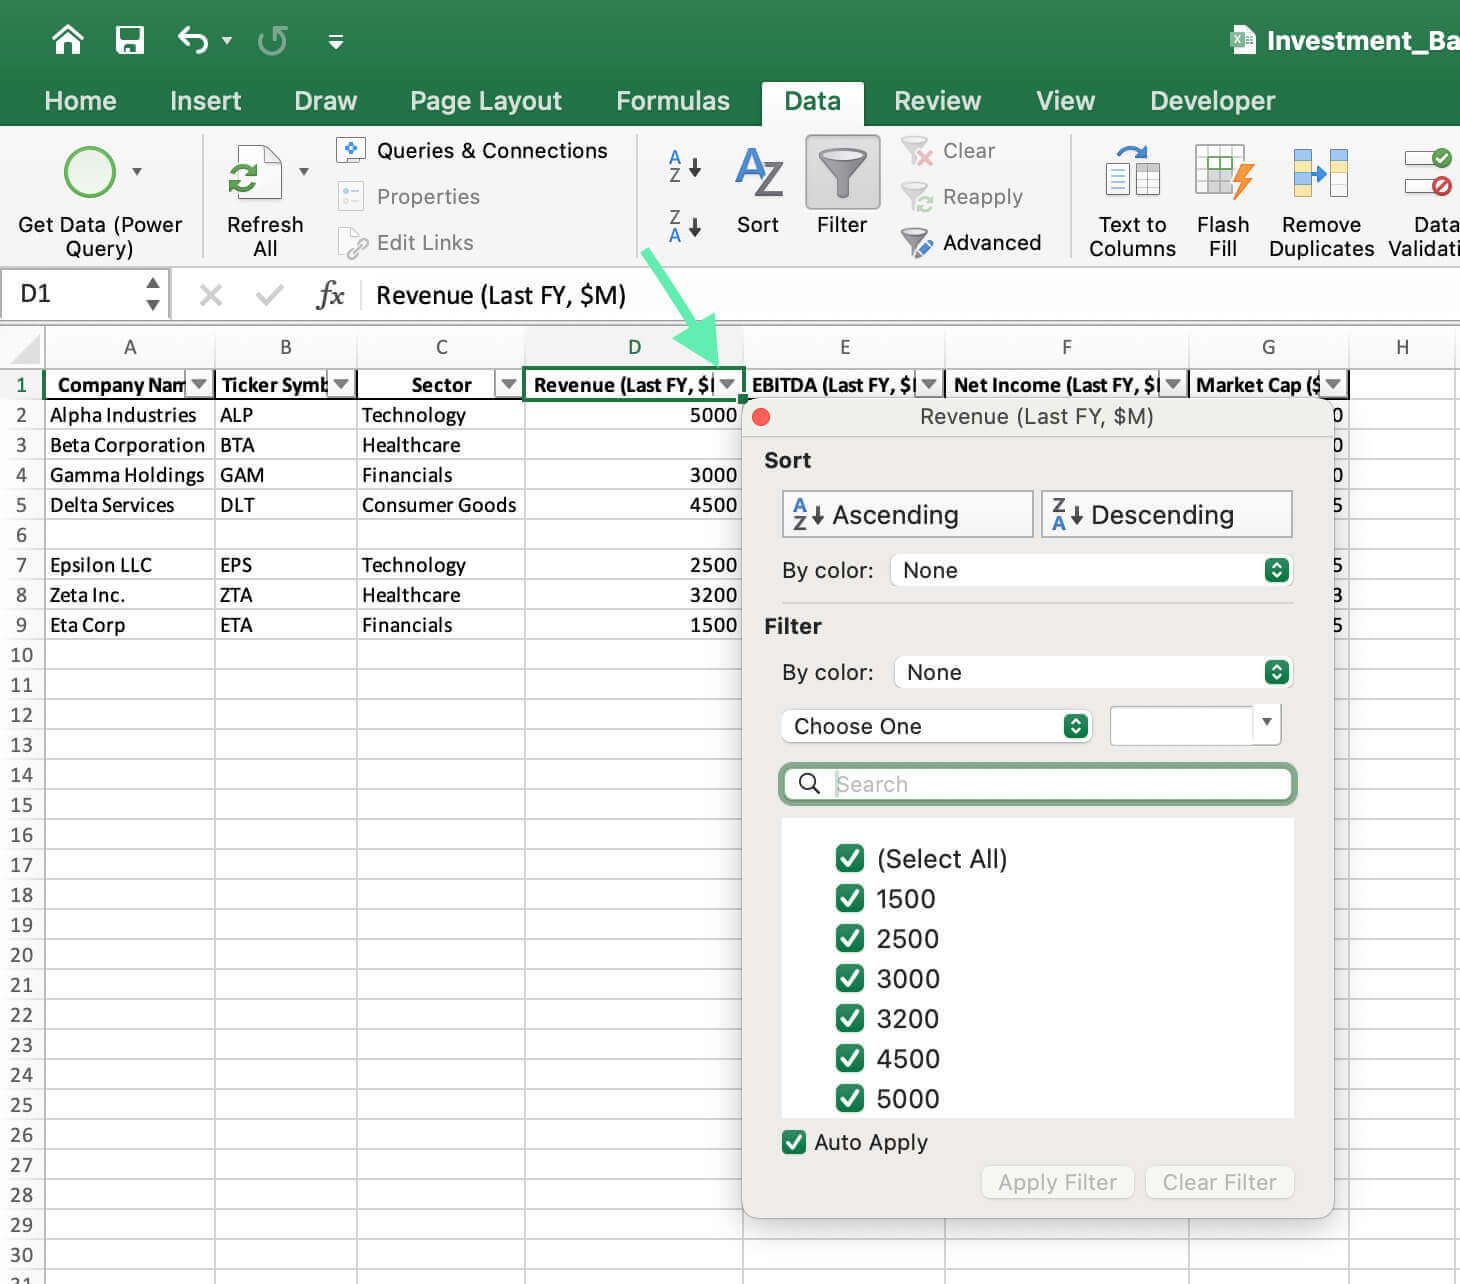
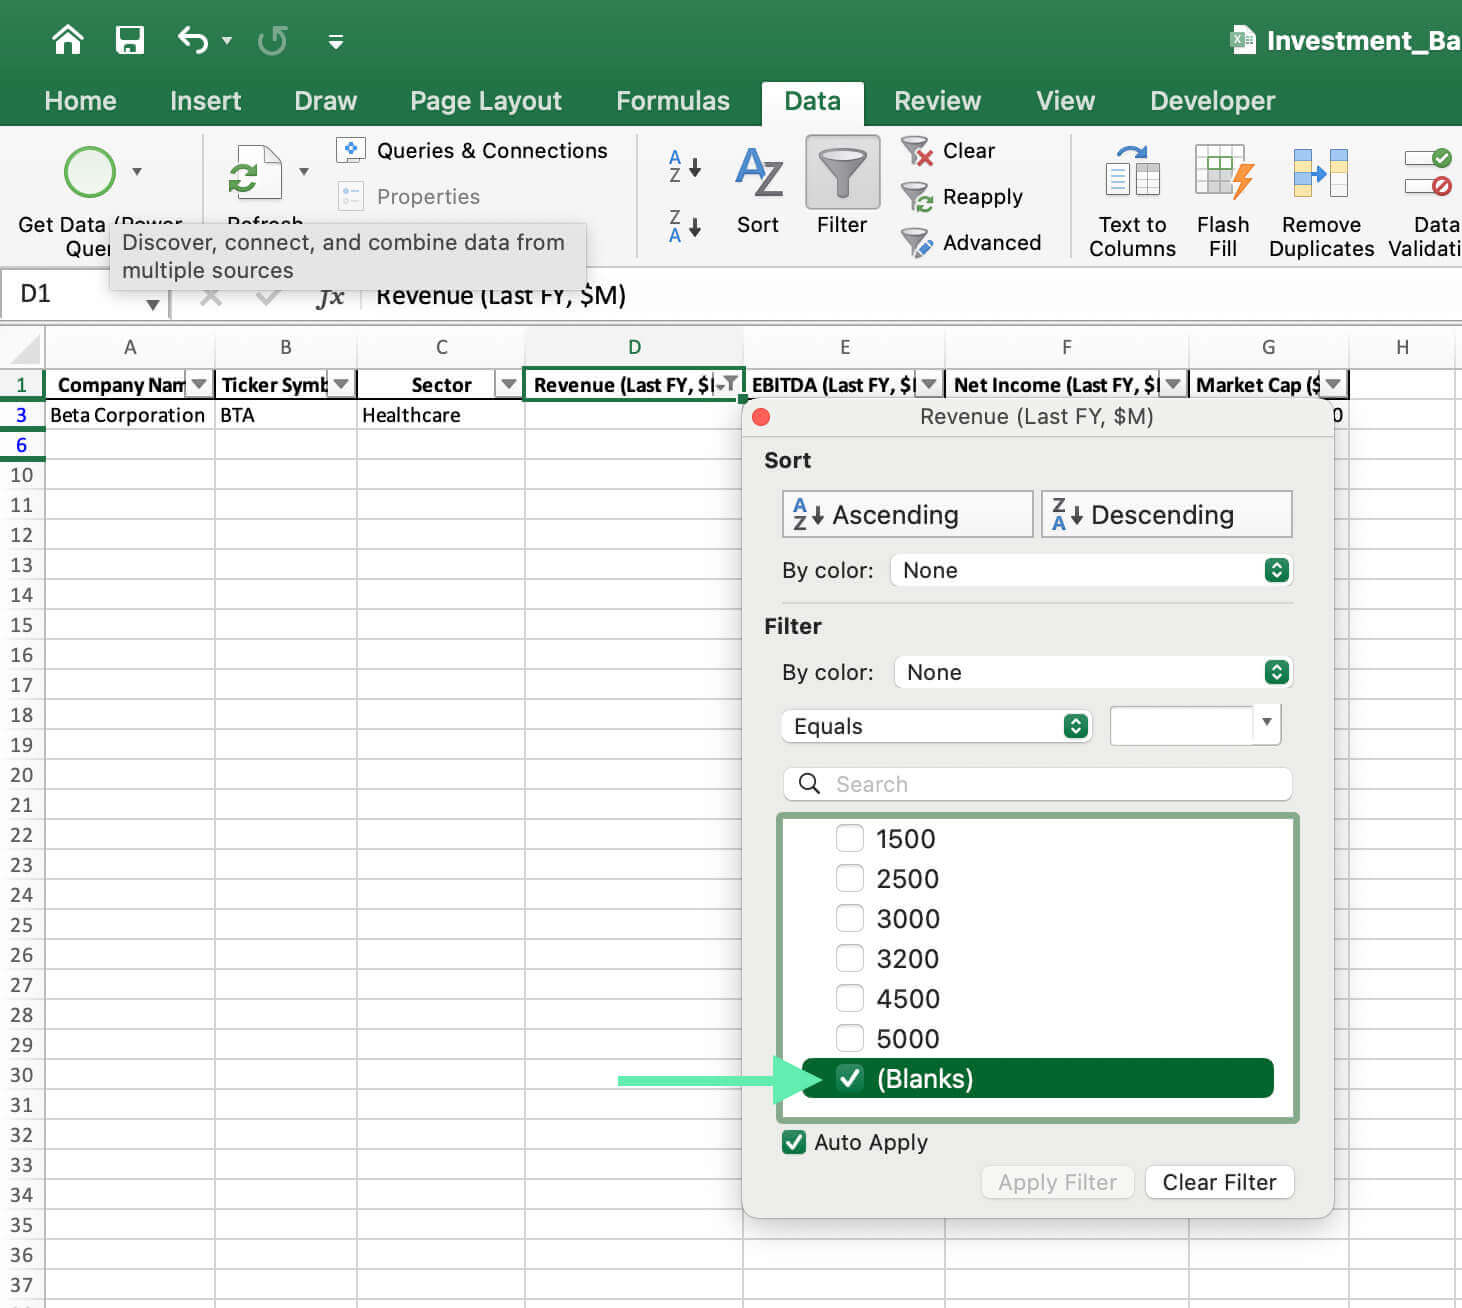
Step 4: Repeat step 3 for all relevant columns to identify rows with missing data.

Method 2: Using the ‘Go To Special’ Feature

Step 1: Select the entire dataset.
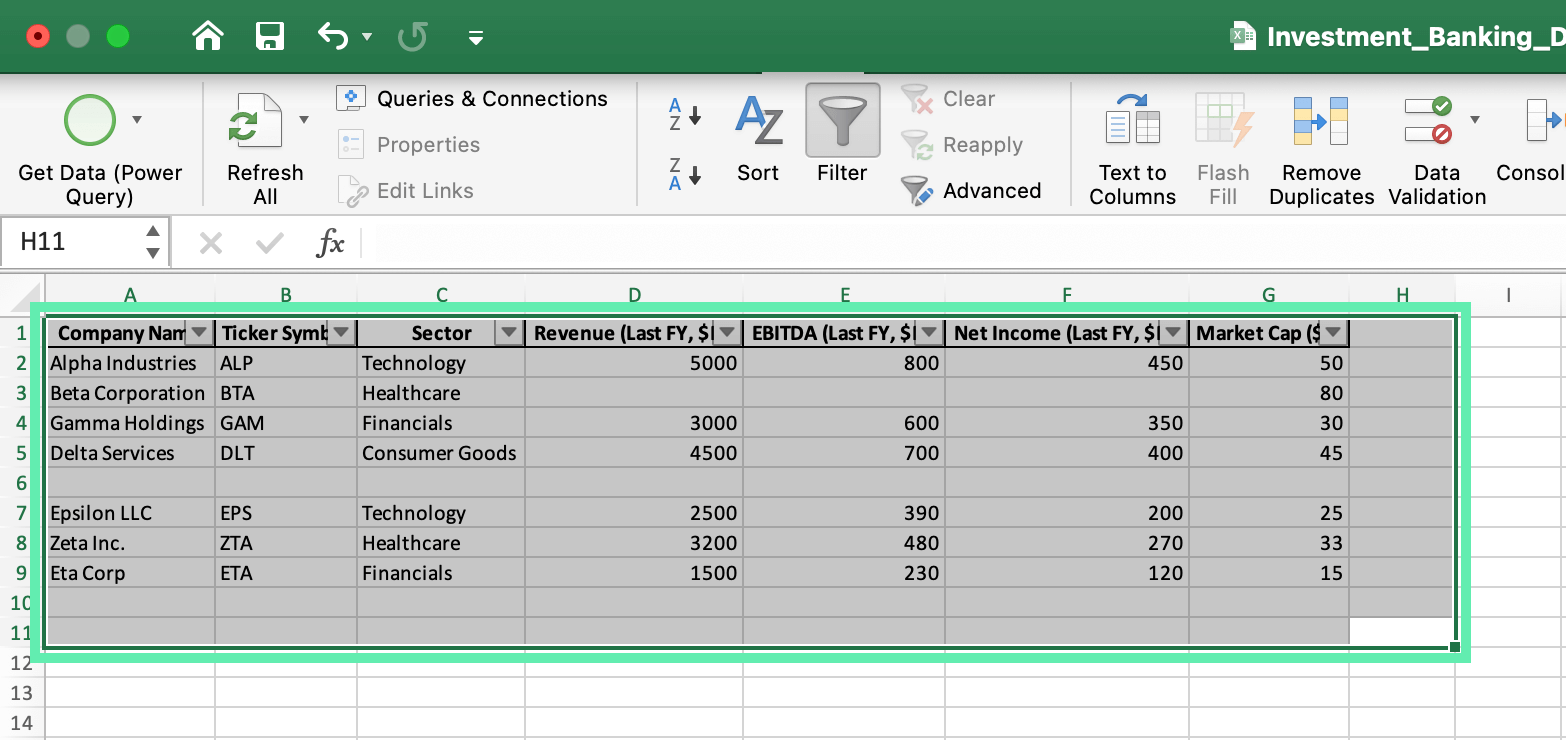
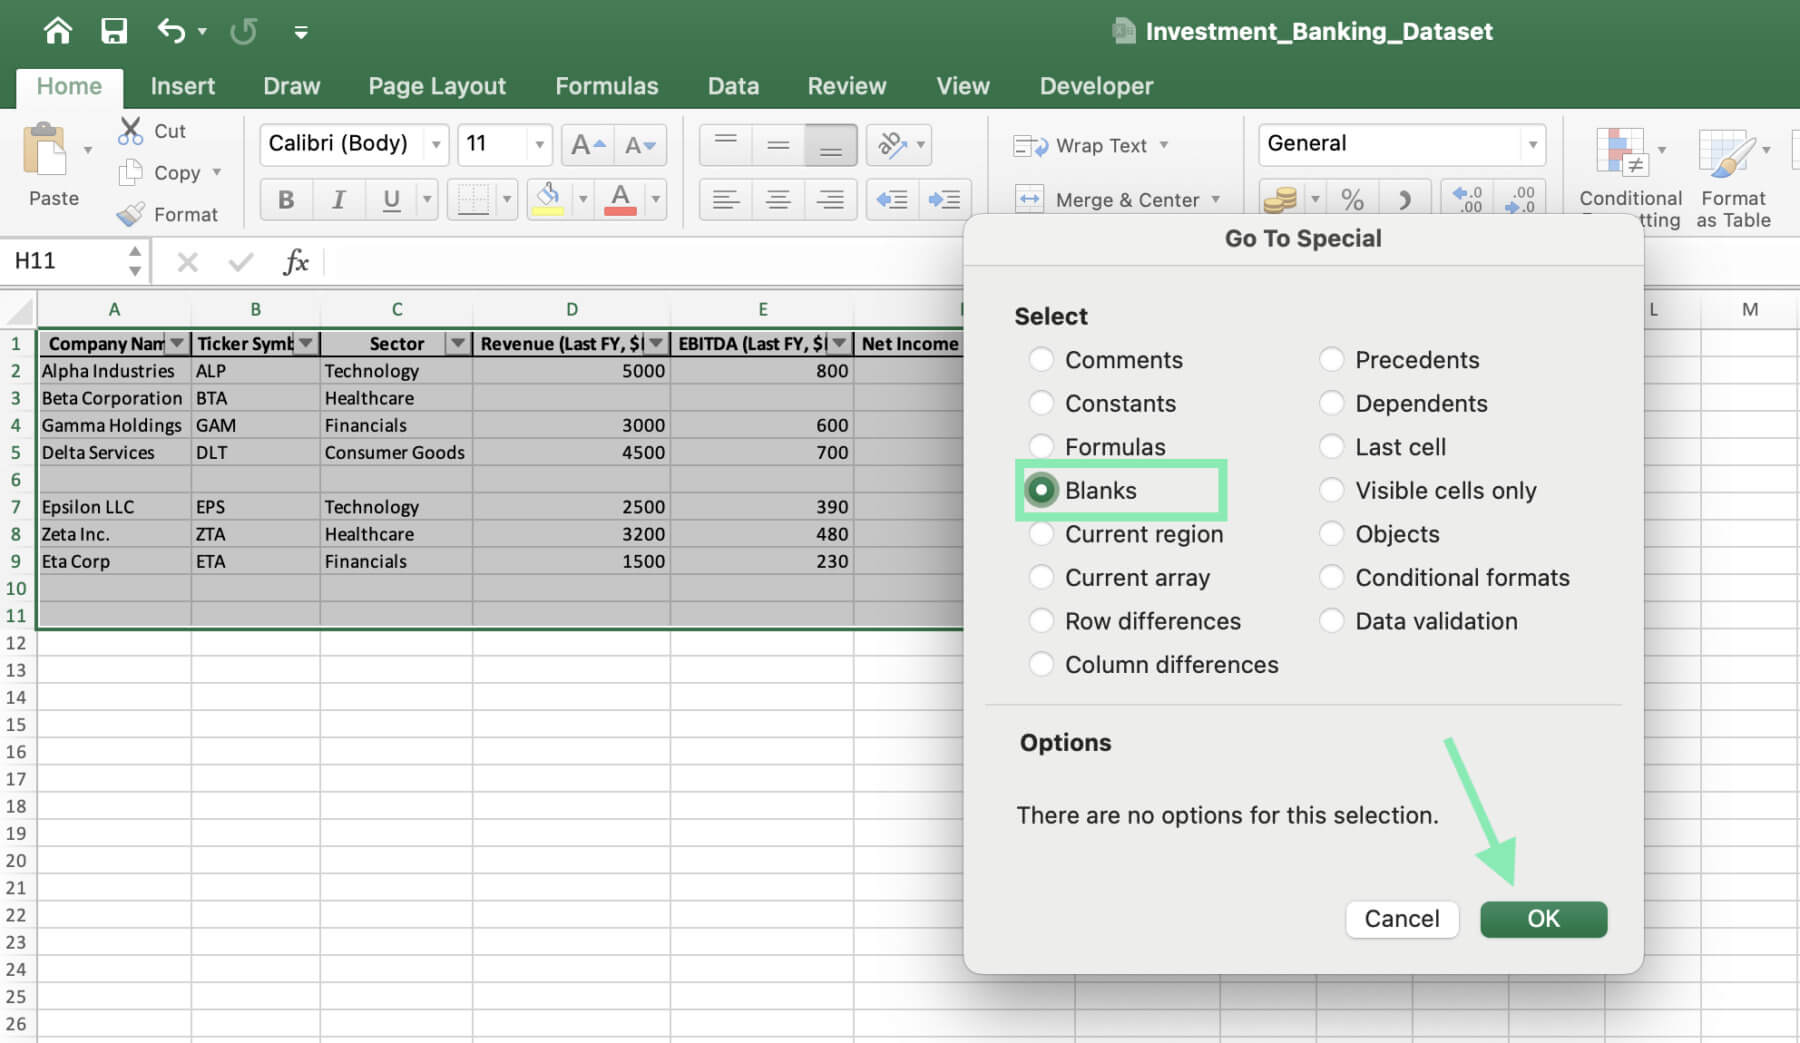
Step 2: Press ‘F5’ or navigate to ‘Home’ > ‘Find & Select’ > ‘Go To Special’.

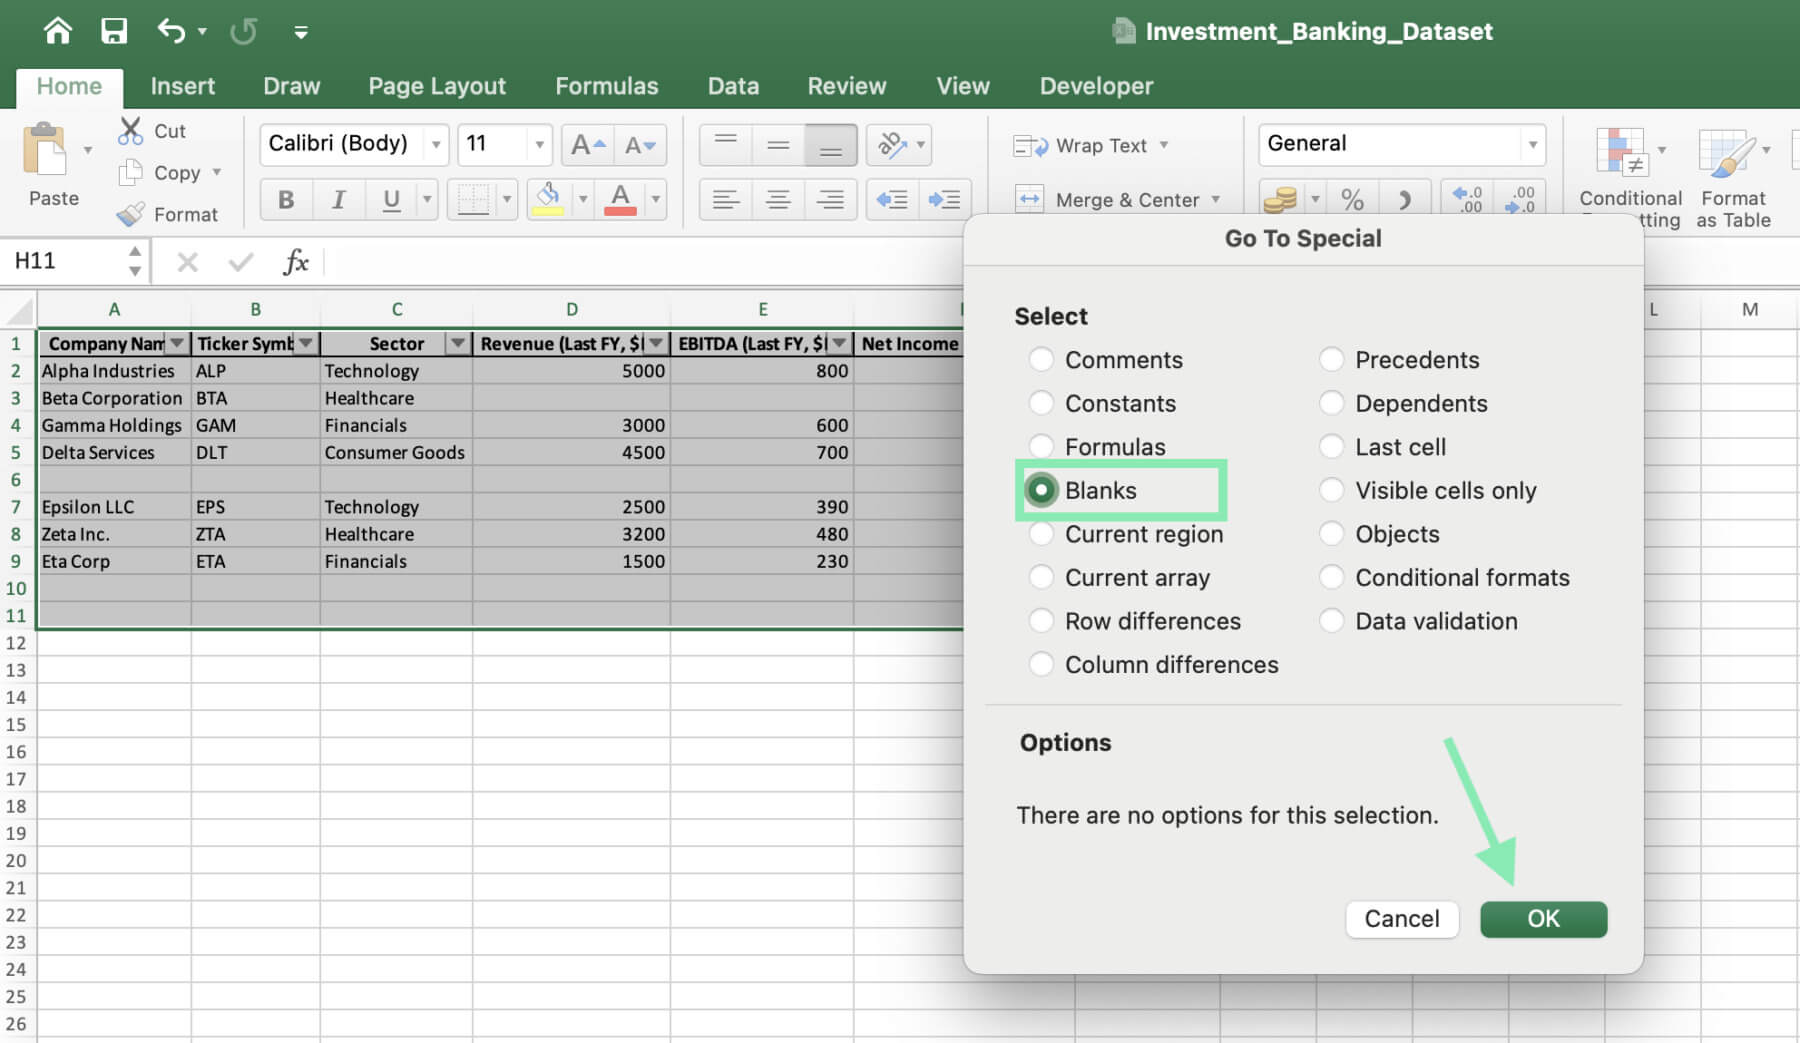
Step 3: In the ‘Go To Special’ dialog box, select ‘Blanks’ and click ‘OK’.
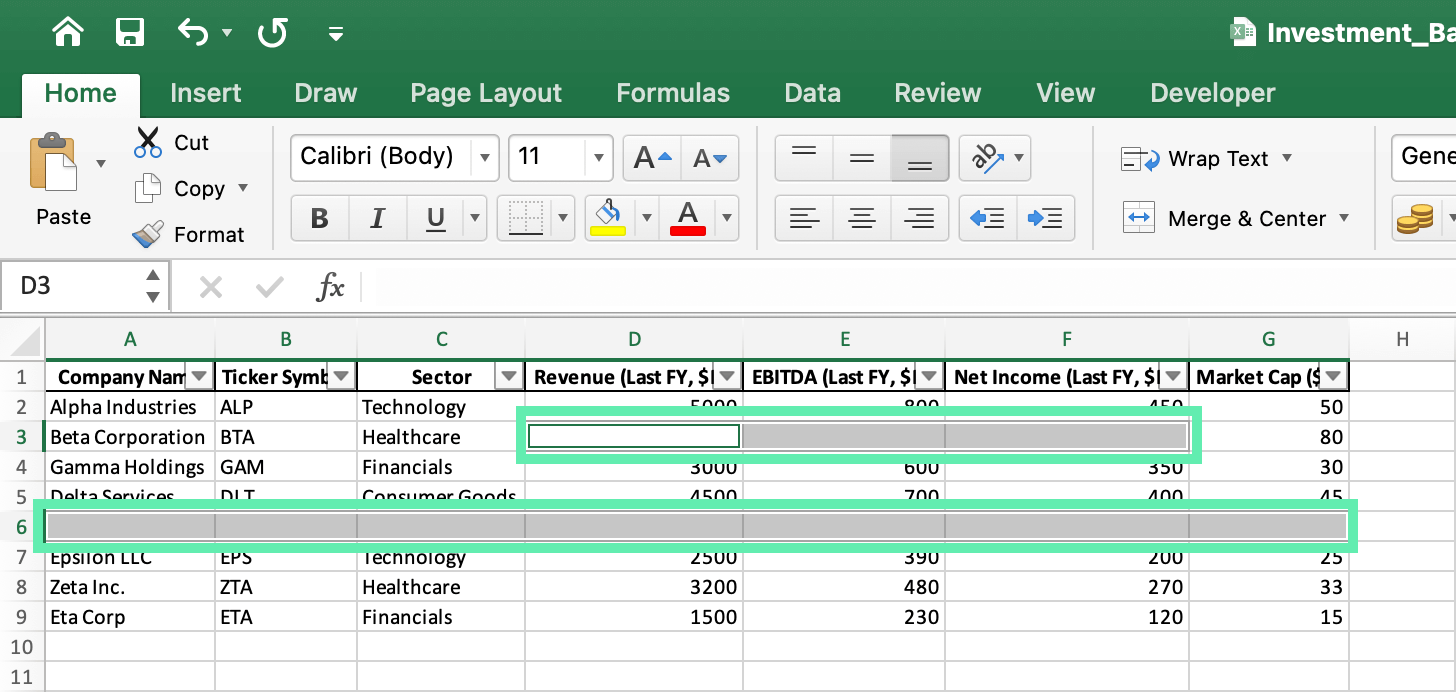
Step 4: Excel will highlight all the blank cells in your dataset, allowing you to identify the blank rows.
Method 3: Creating a Helper Column

Step 1: Insert a new column next to your dataset.
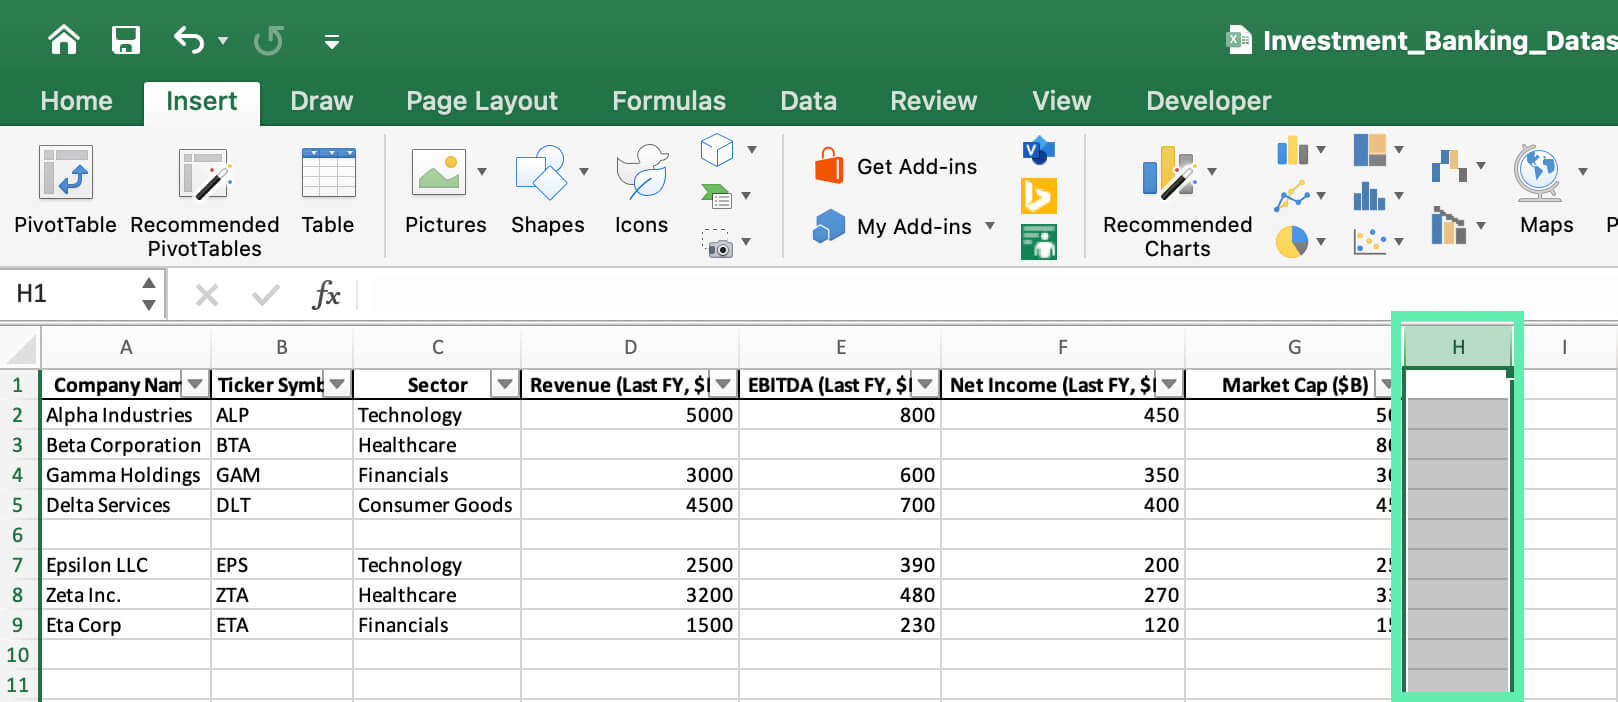
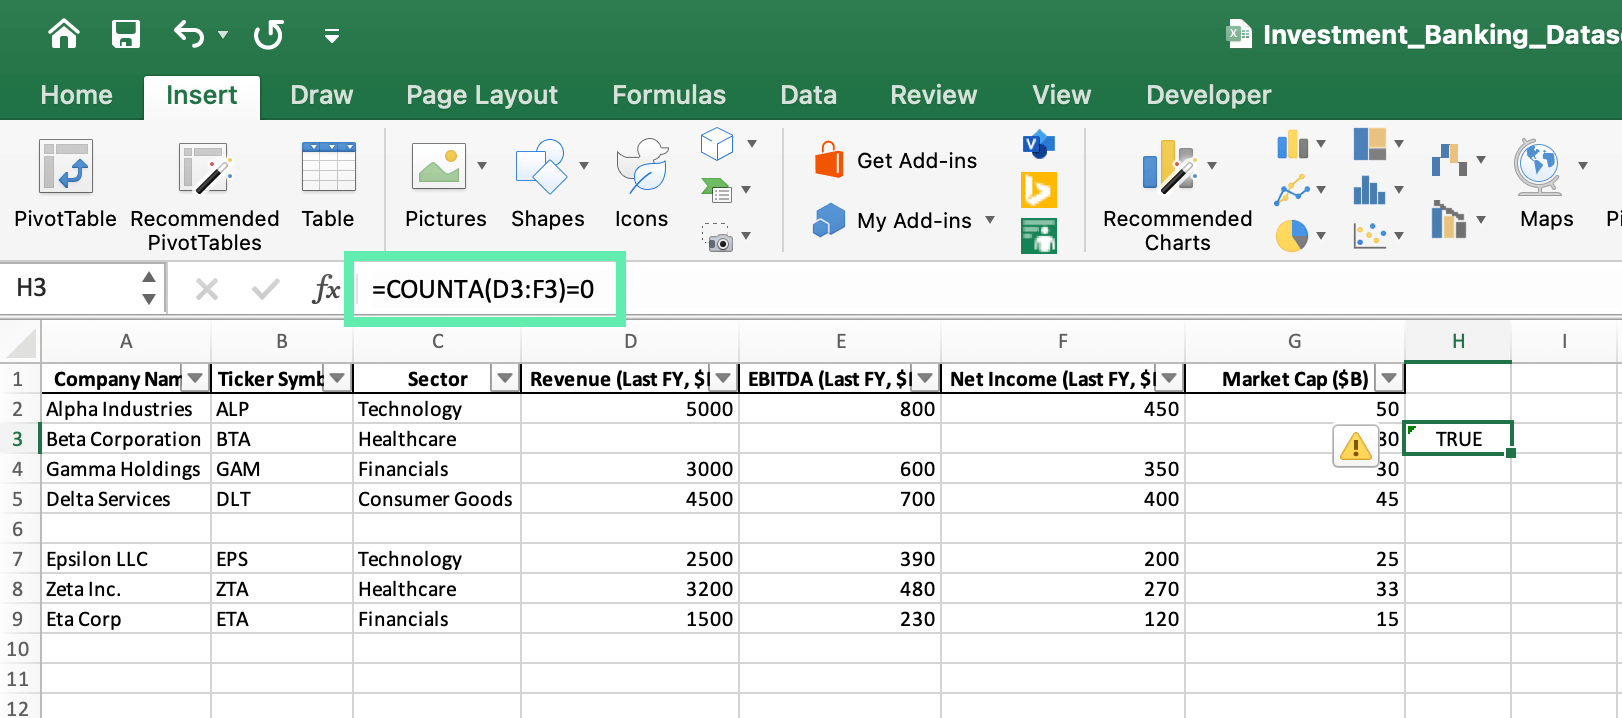
Step 2: In the first cell of the new column with blank data, enter the formula: =COUNTA(D3:F3)=0.
Step 3: Drag the formula down so that it will be applied to all rows.
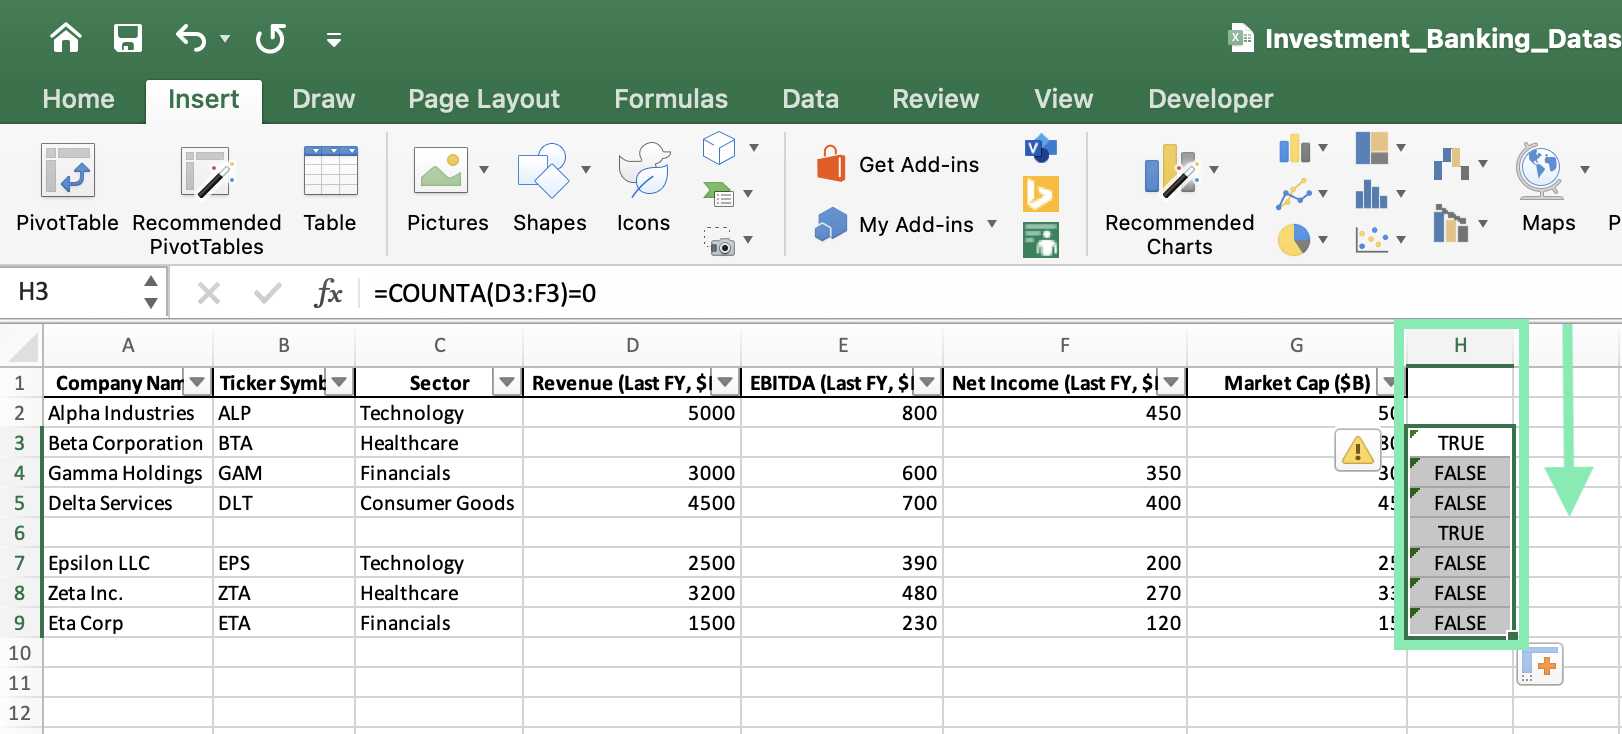
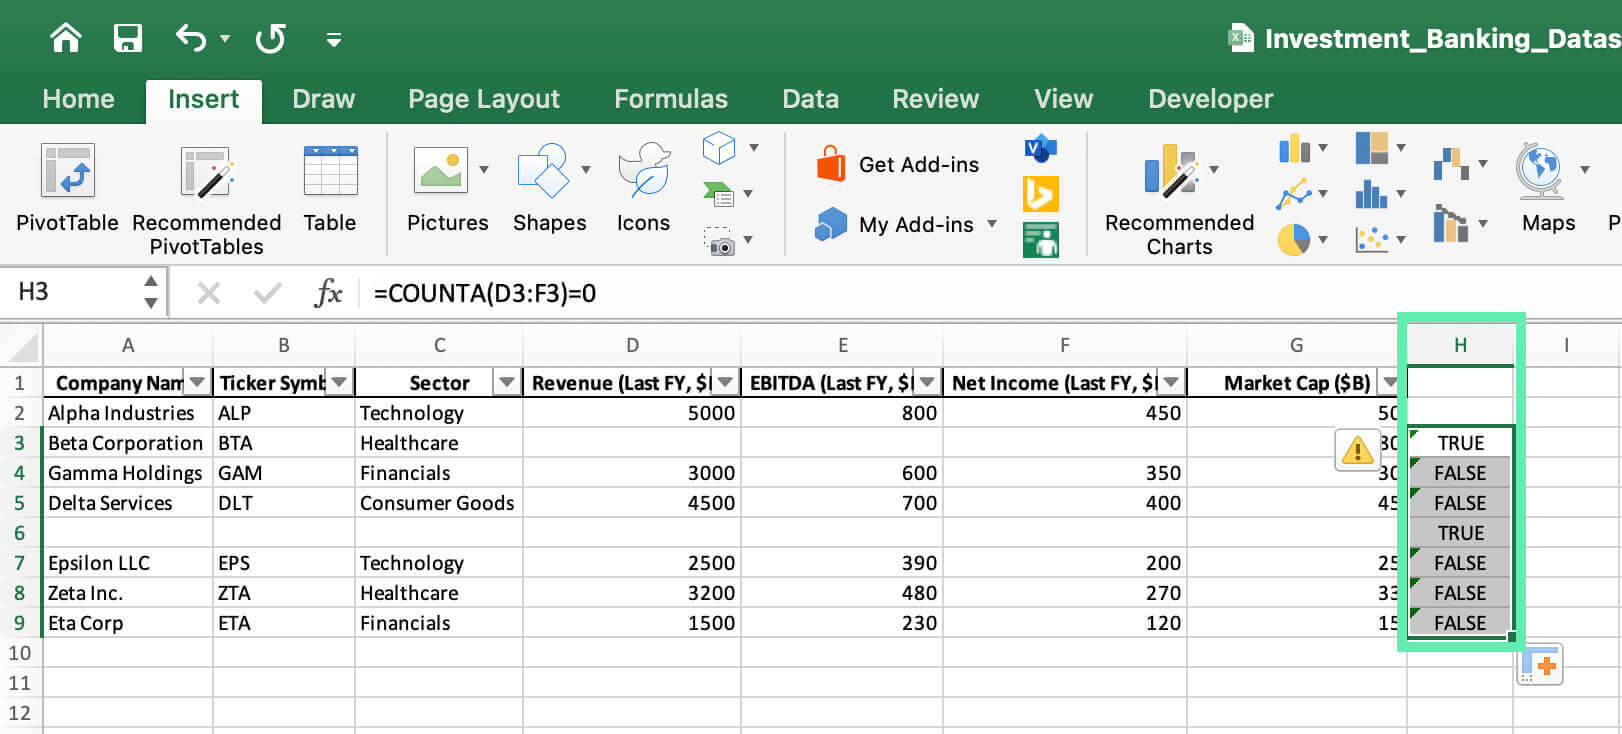
Step 4: The helper column will display ‘TRUE’ for blank rows and ‘FALSE’ for non-blank rows.
How to Remove Blank Rows in Excel

Here are the different ways to remove blank rows in Excel:

Method 1: Manual Deletion

Step 1: Highlight the blank rows.
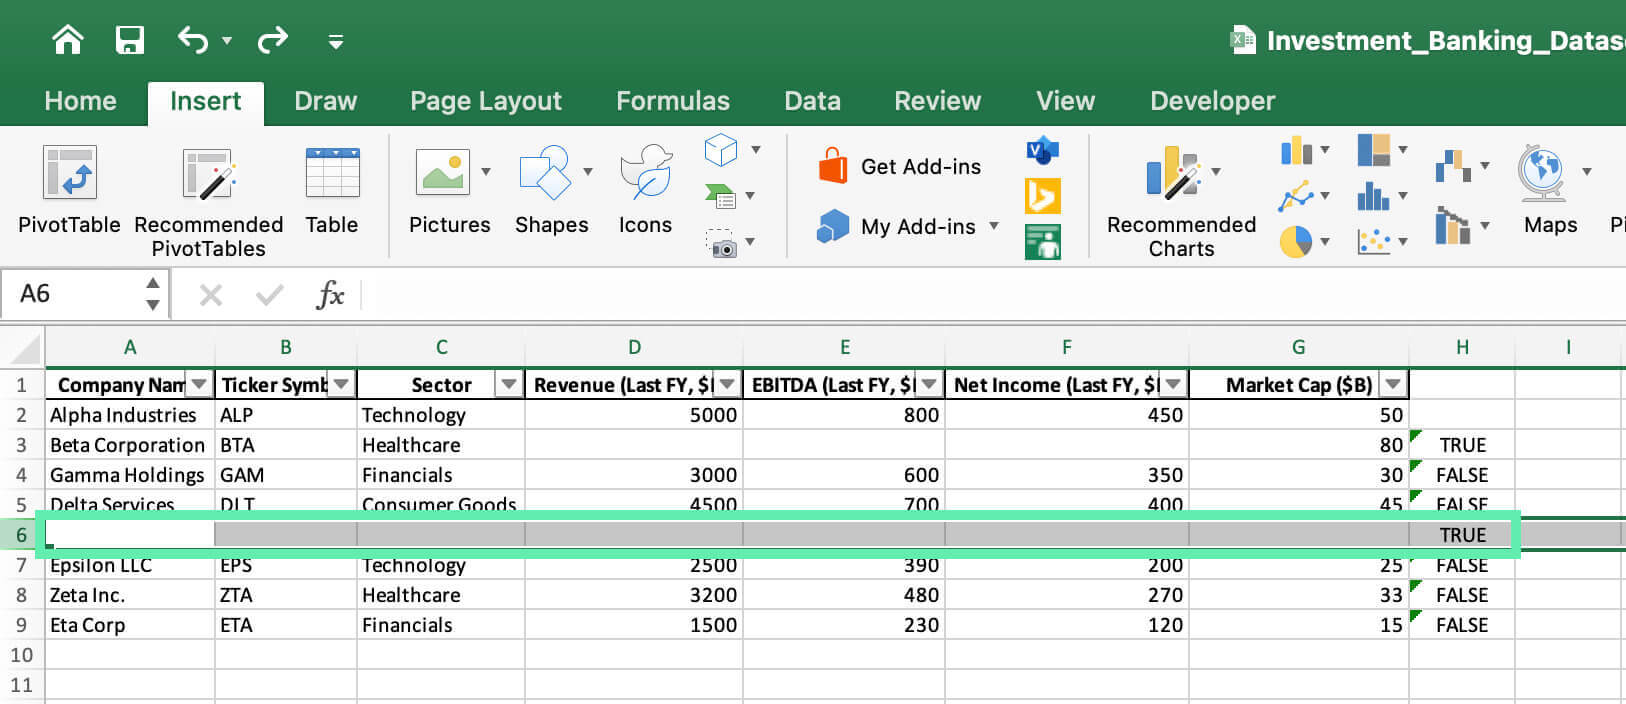
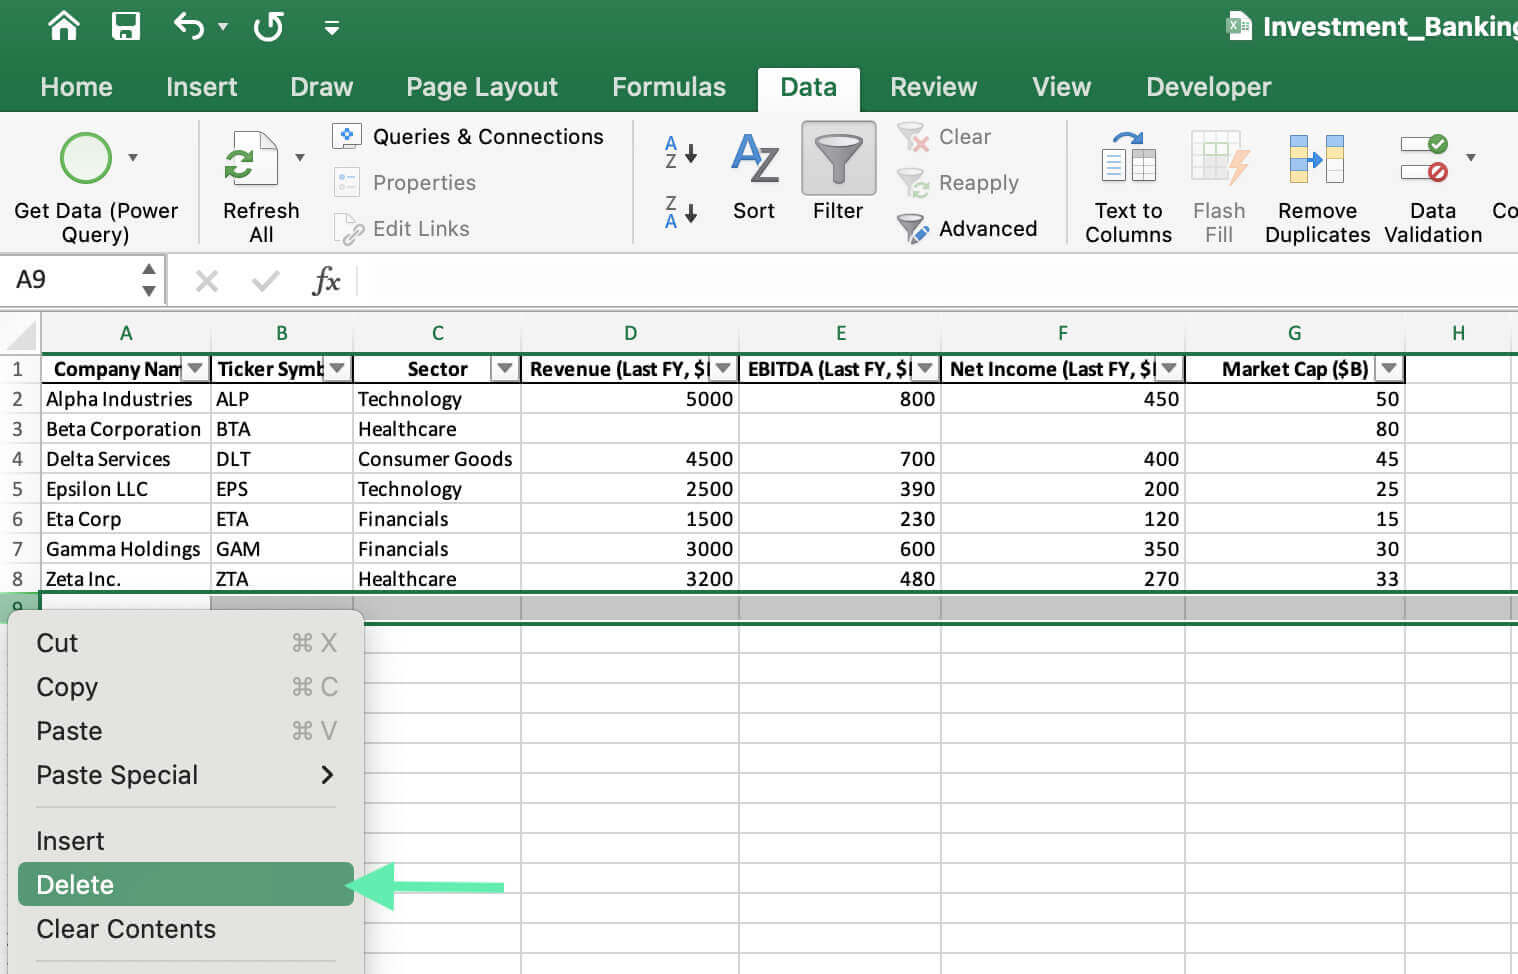
Step 2: Right-click on the row numbers of the blank rows and select ‘Delete’.
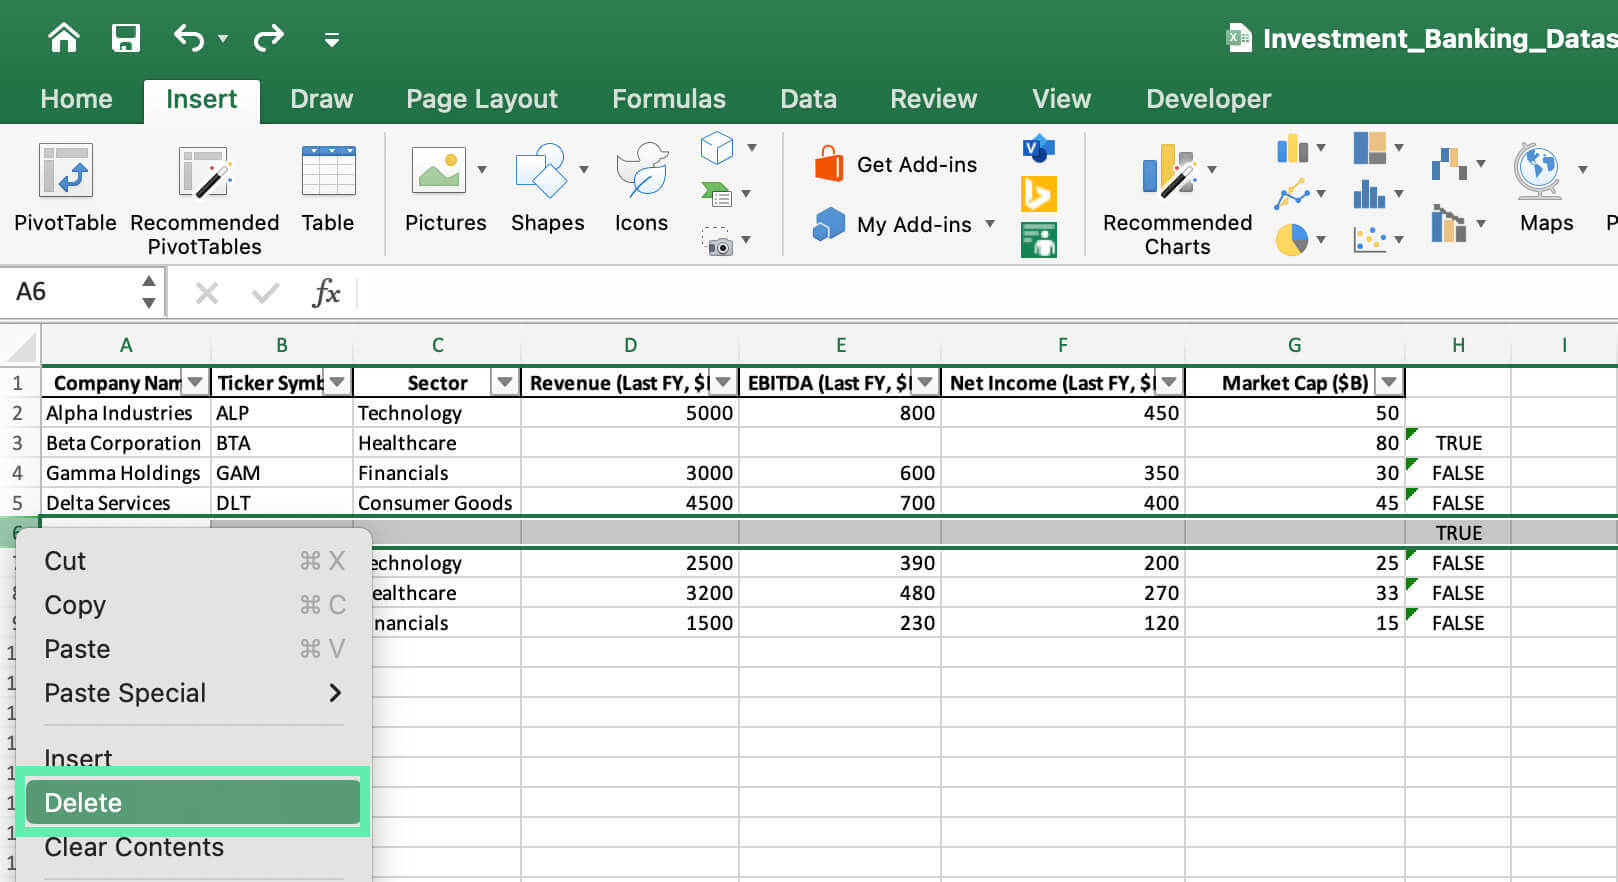
Method 2: Using Sort & Filter

Step 1: Select the entire dataset.
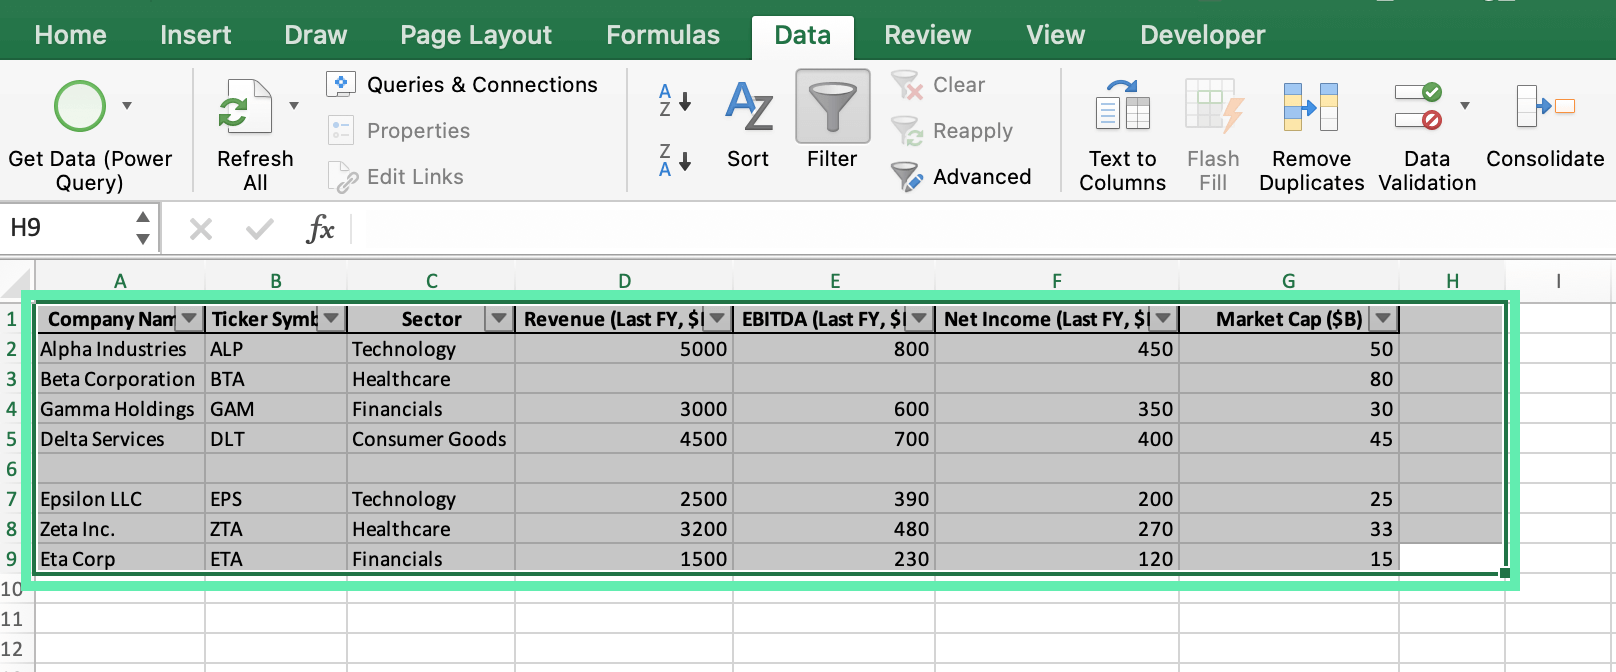
Step 2: Go to the ‘Data’ tab and click on ‘Sort’.
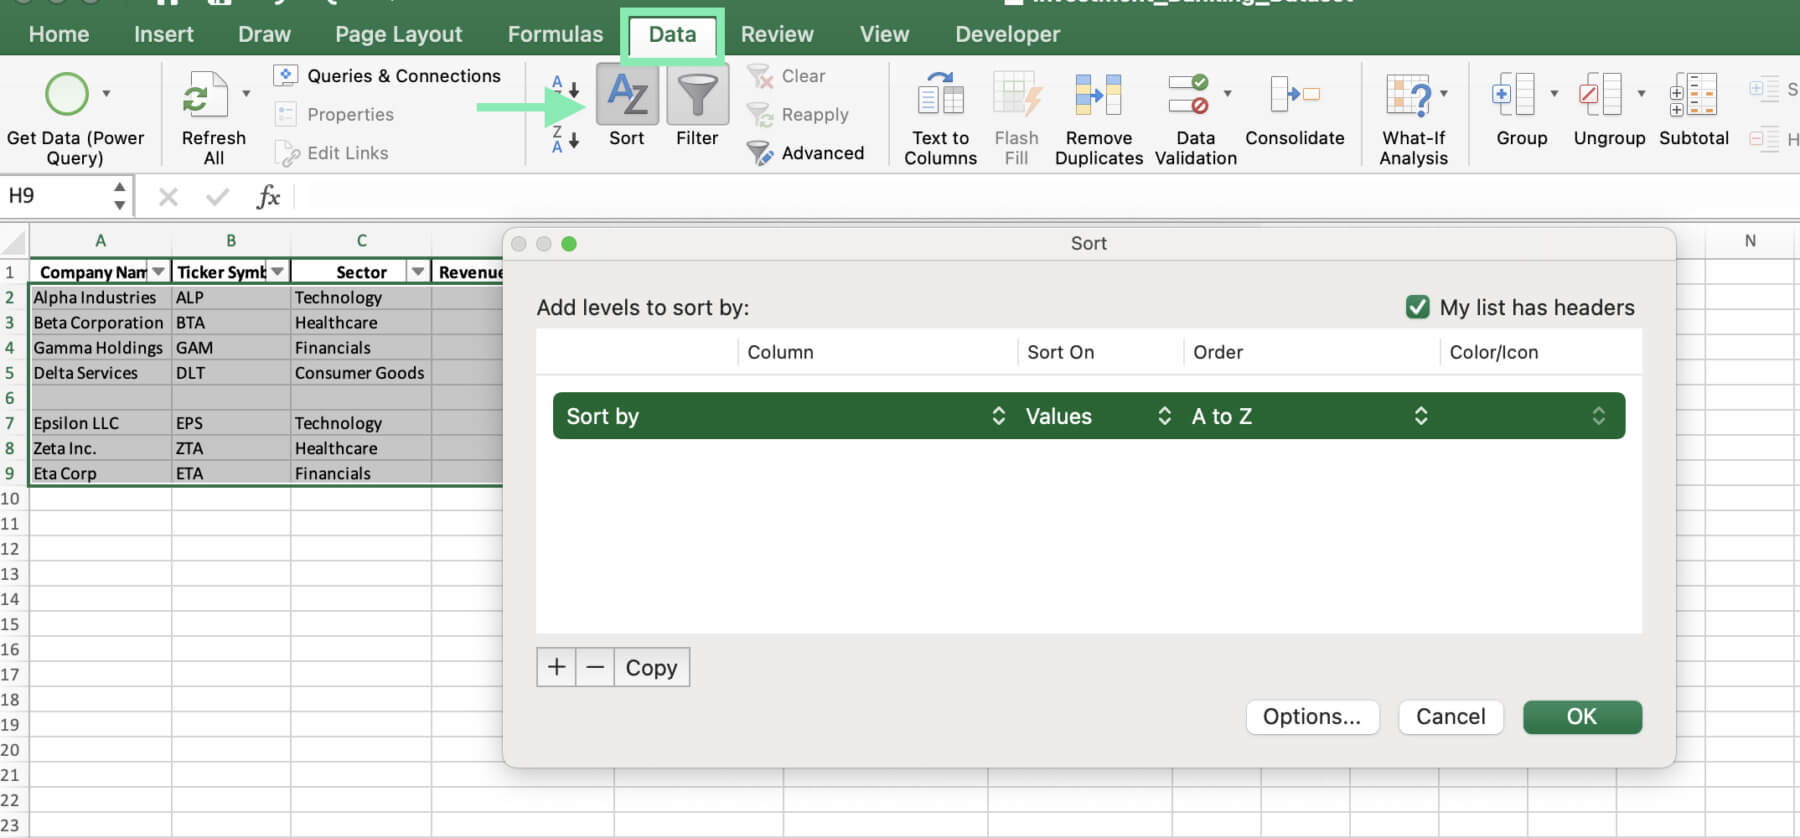
Step 3: In the ‘Sort’ dialog box, select a column that is likely to have data in every row (e.g., ‘Company Name’).
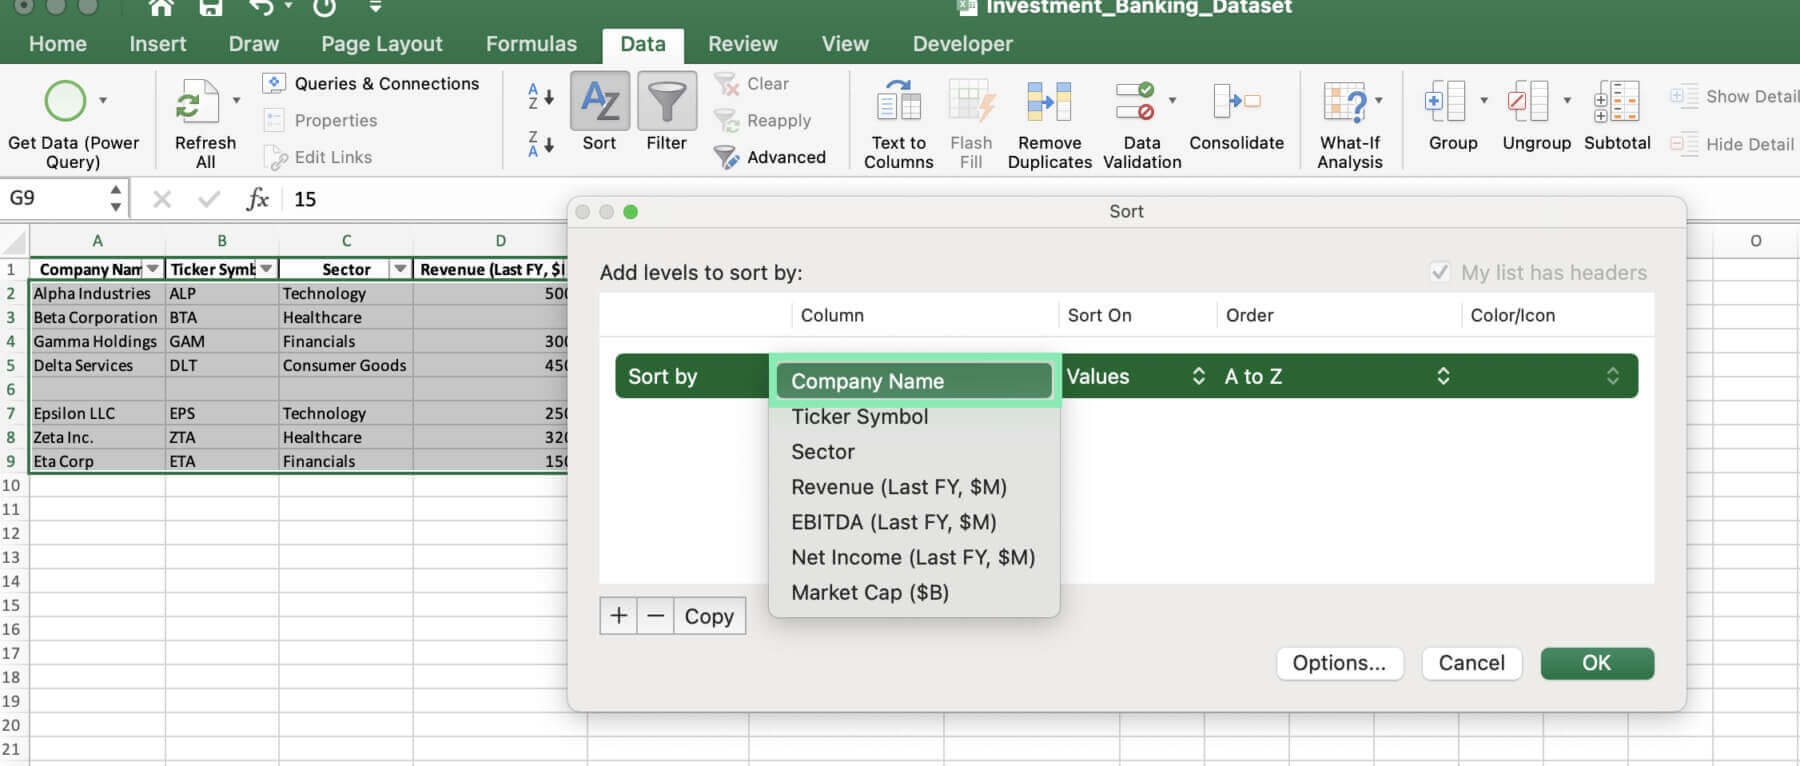
Step 4: Click ‘OK’ to sort the data.
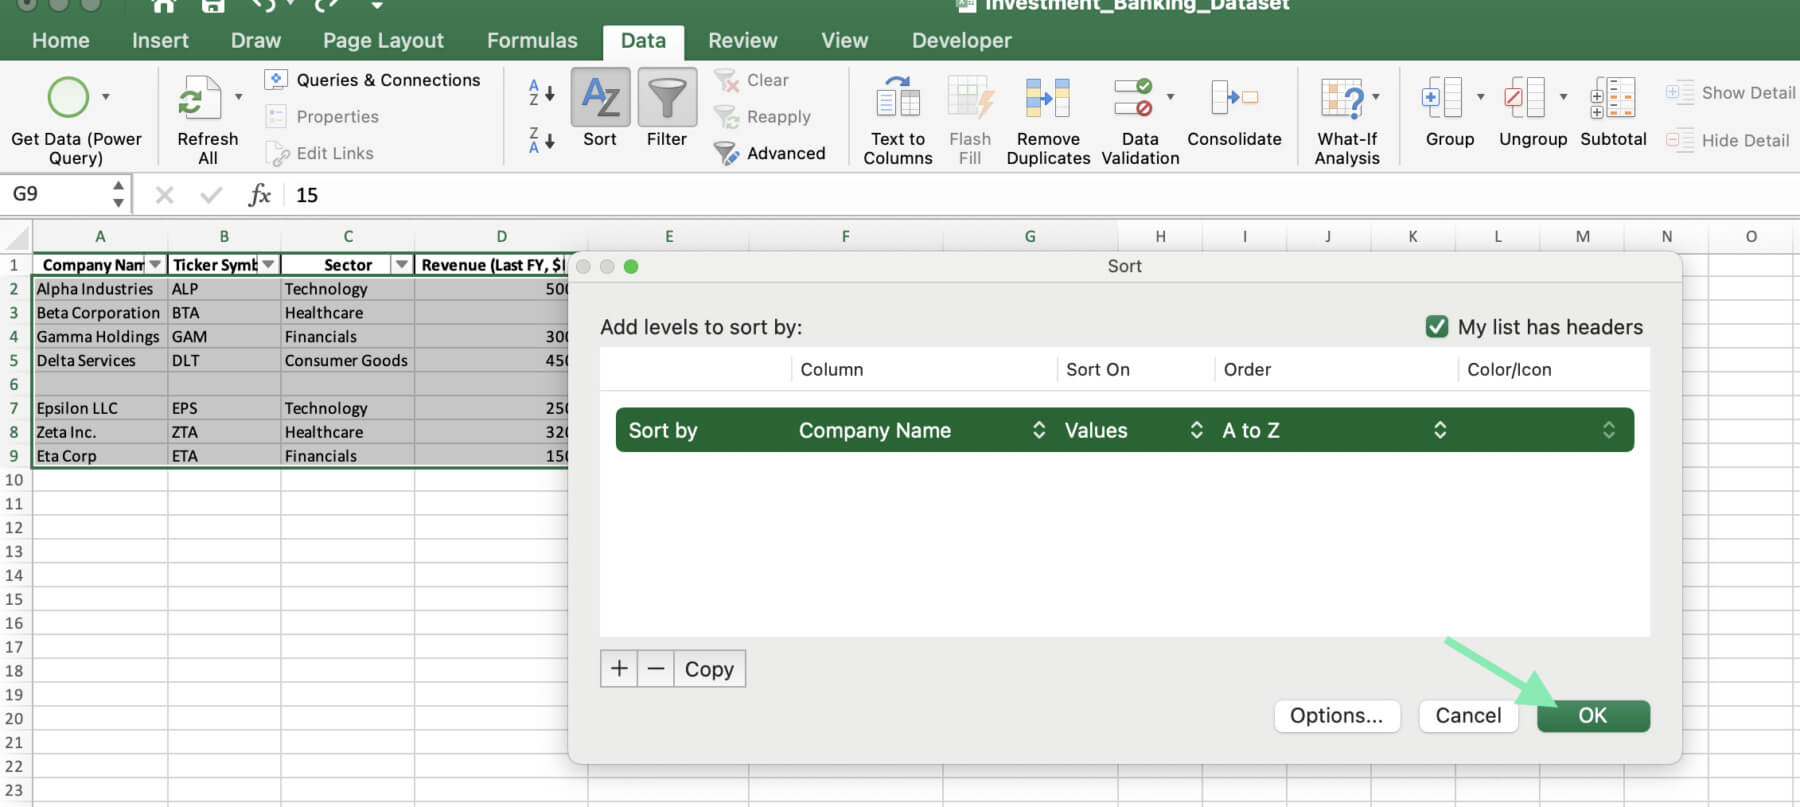
Step 5: The blank rows will now be consolidated at the bottom of the dataset.

Step 6: Select the blank rows and delete them.
Method 3: Using a VBA Script

Step 1: Press ‘Alt + F11’ for Windows (or ‘Fn + option + F11’ for Mac) to open the Visual Basic Editor.
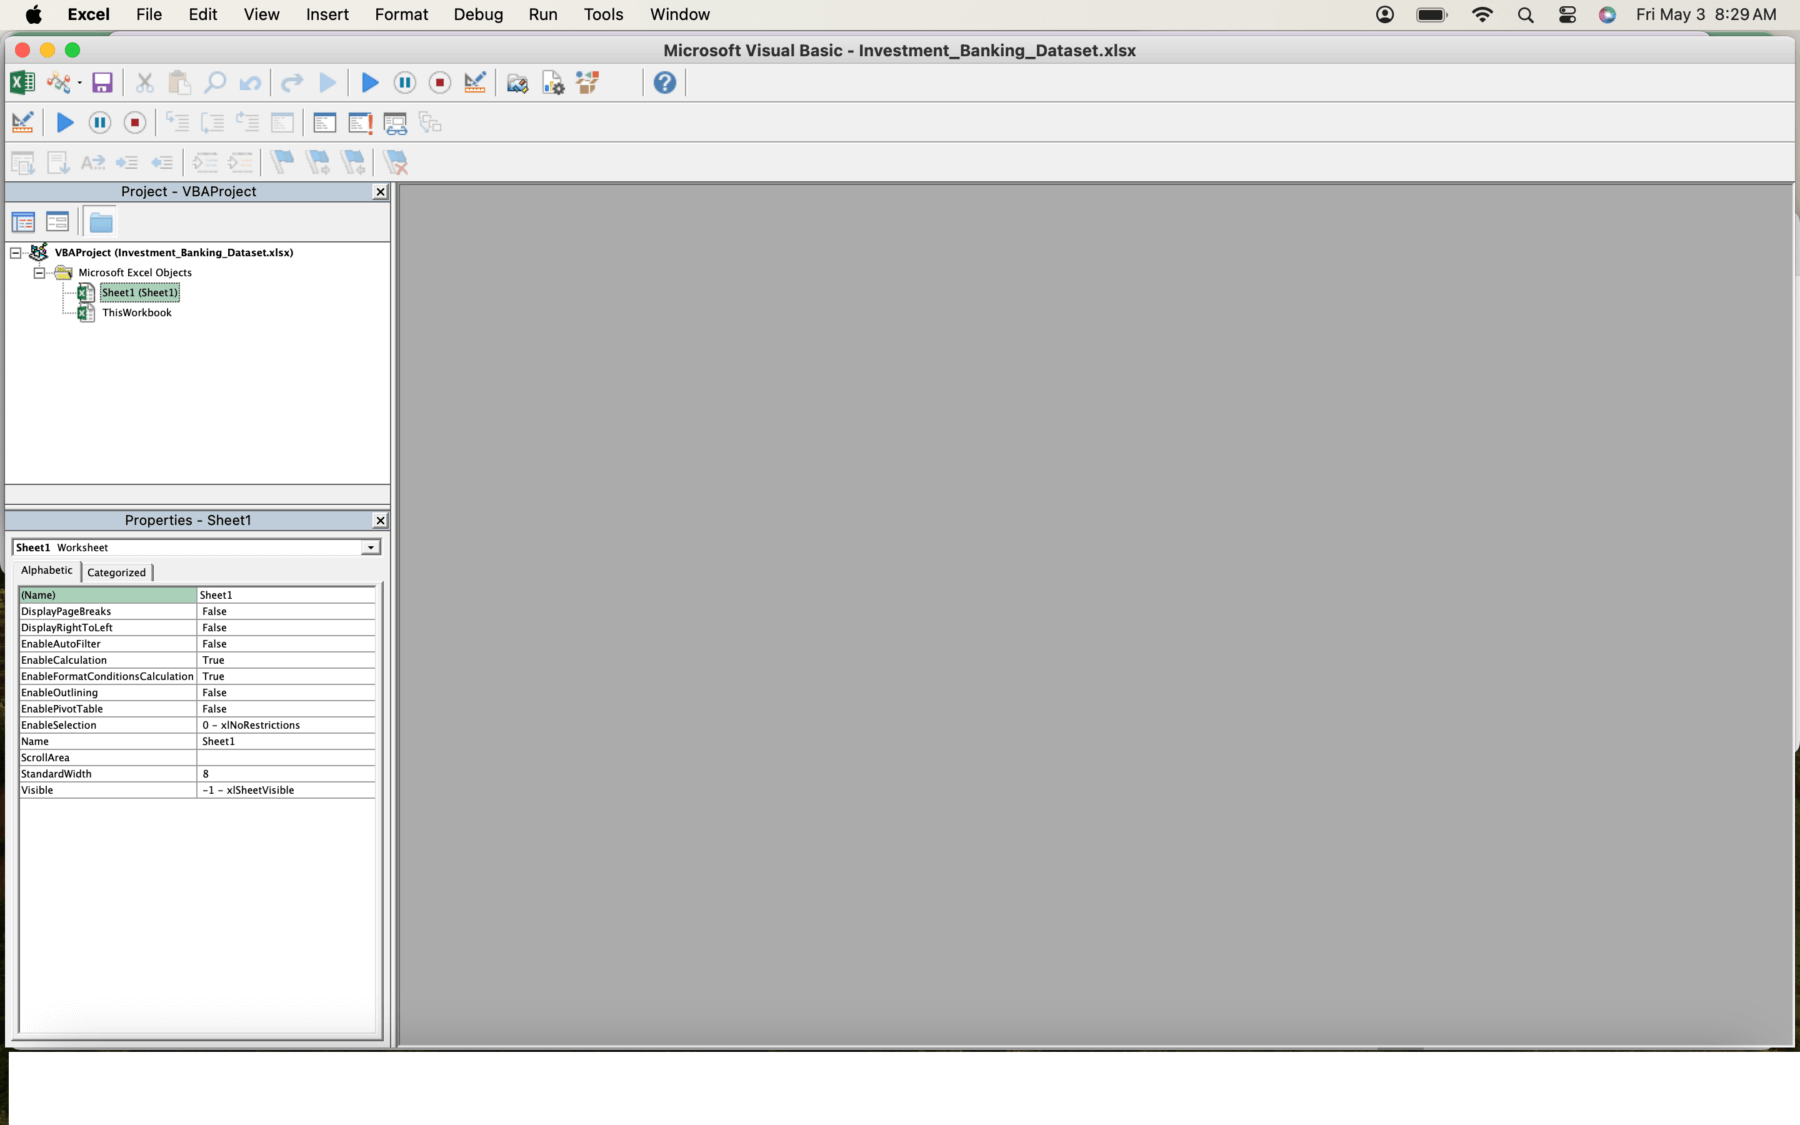
Step 2: In the ‘Project’ pane, click on your workbook and go to ‘Insert’ > ‘Module’.
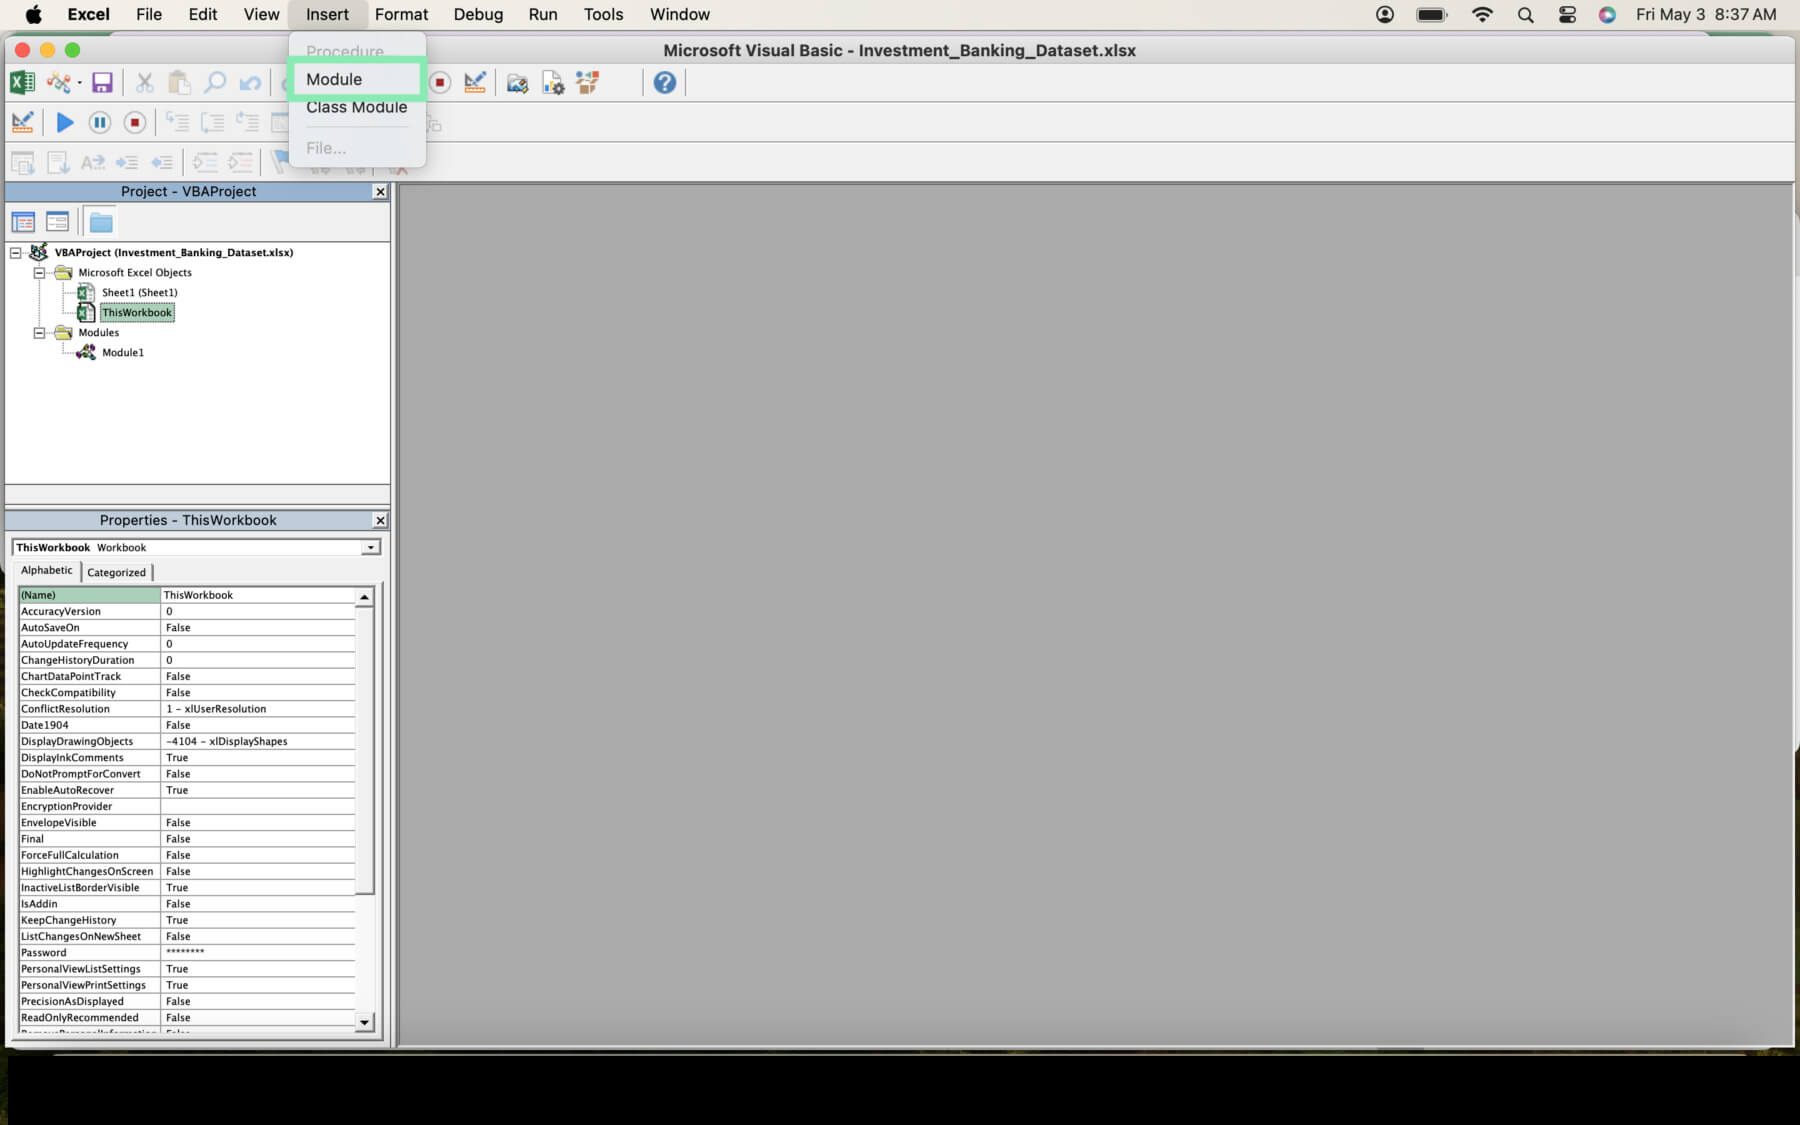
Step 3: Copy and paste the following VBA script into the module.

Sub RemoveBlankRows()
    Dim LastRow As Long
    Dim RowCount As Long
    Dim i As Long

    LastRow = Cells(Rows.Count, 1).End(xlUp).Row
    RowCount = 0

    Application.ScreenUpdating = False

    For i = LastRow To 1 Step -1
         If WorksheetFunction.CountA(Rows(i)) = 0 Then
             Rows(i).Delete
             RowCount = RowCount + 1
        End If
    Next I

    Application.ScreenUpdating = True

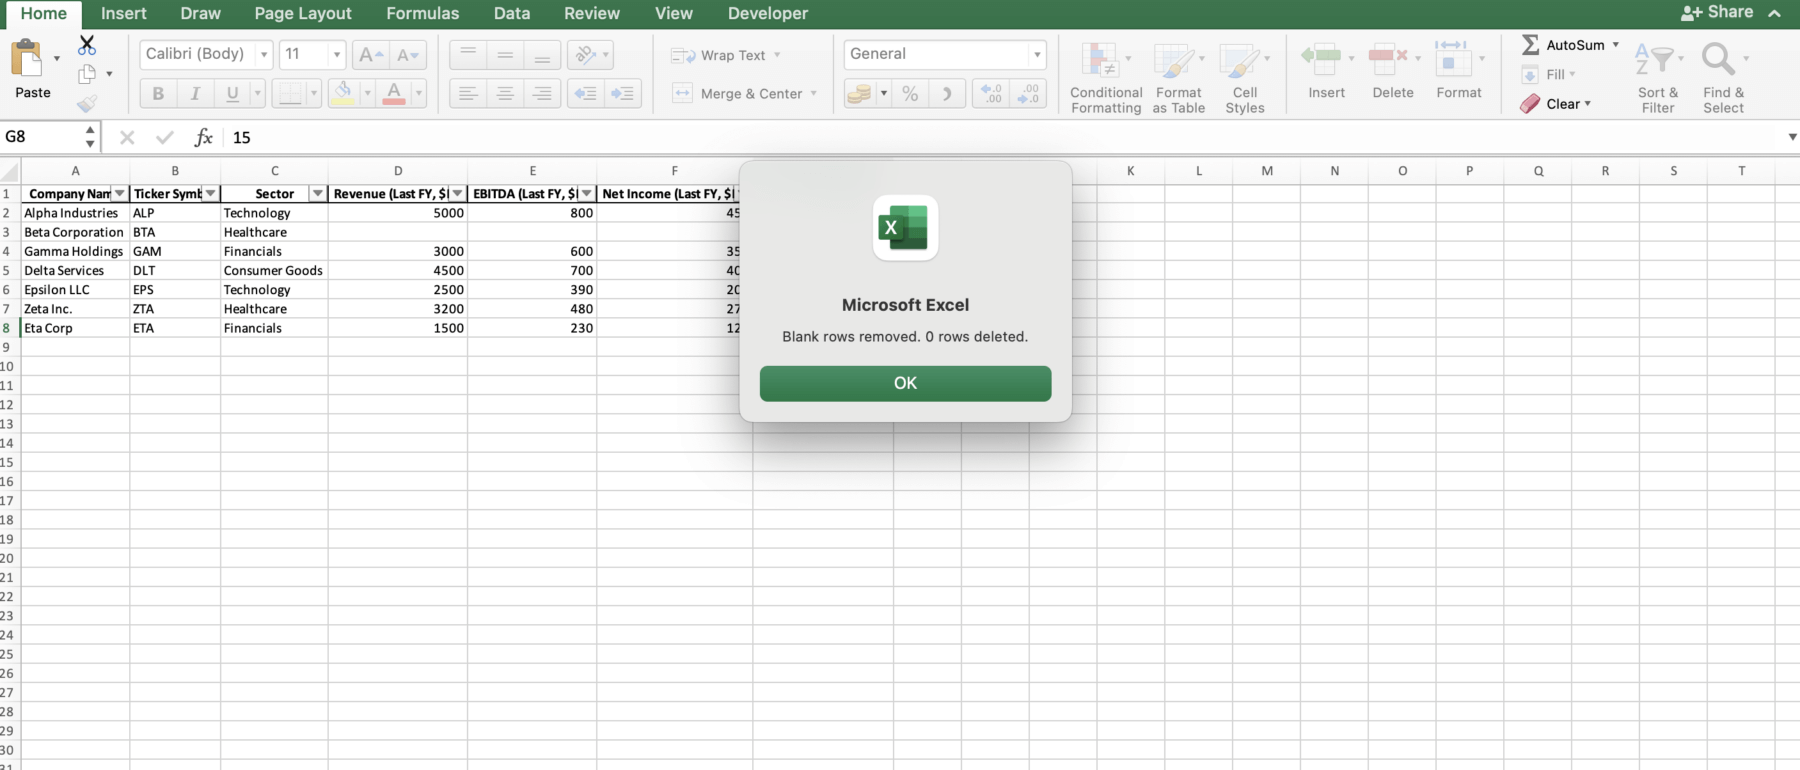
    MsgBox “Blank rows removed. ” & RowCount & ” rows deleted.”
End Sub

Step 4: Close the Visual Basic Editor and return to your Excel workbook.
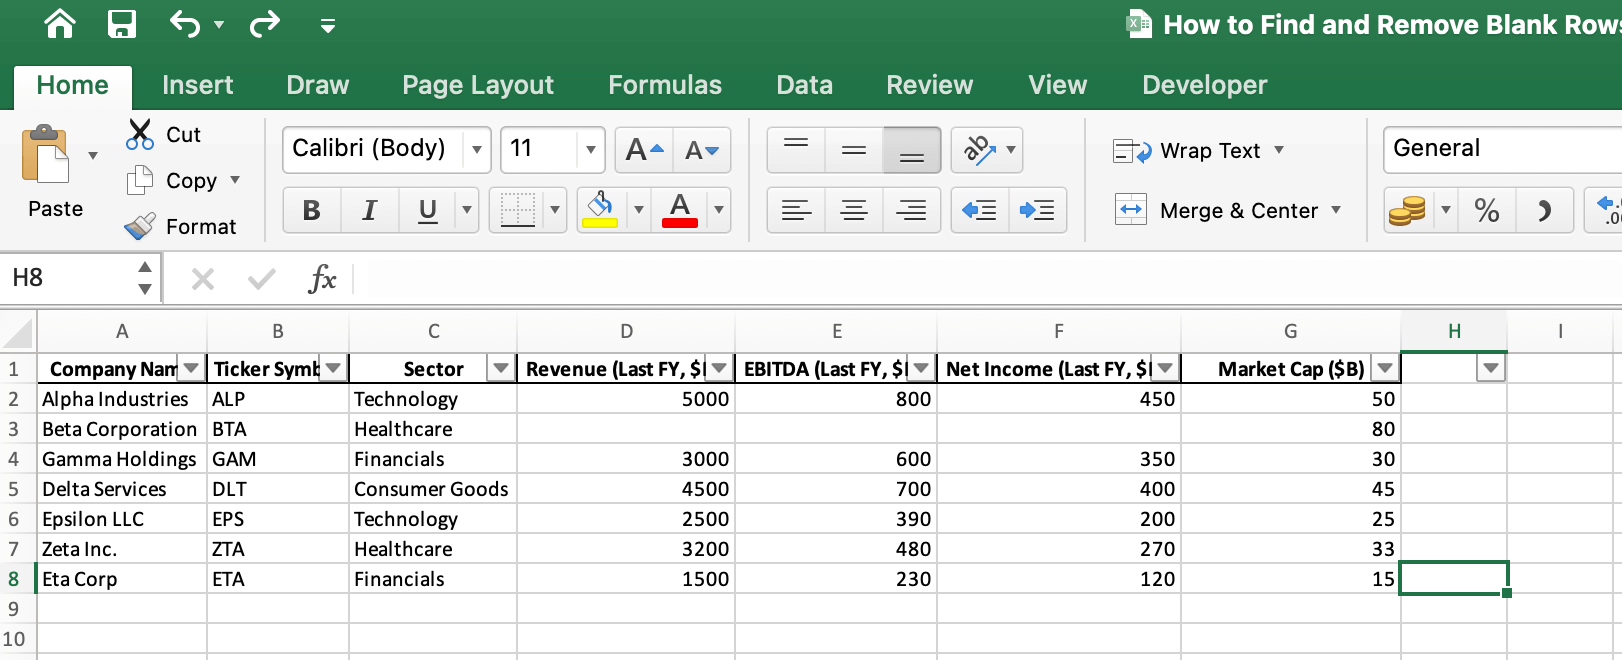
Step 5: Press ‘Alt + F8’ for Windows or ‘Fn + option + F8’ for Mac to open the ‘Macro’ dialog box.
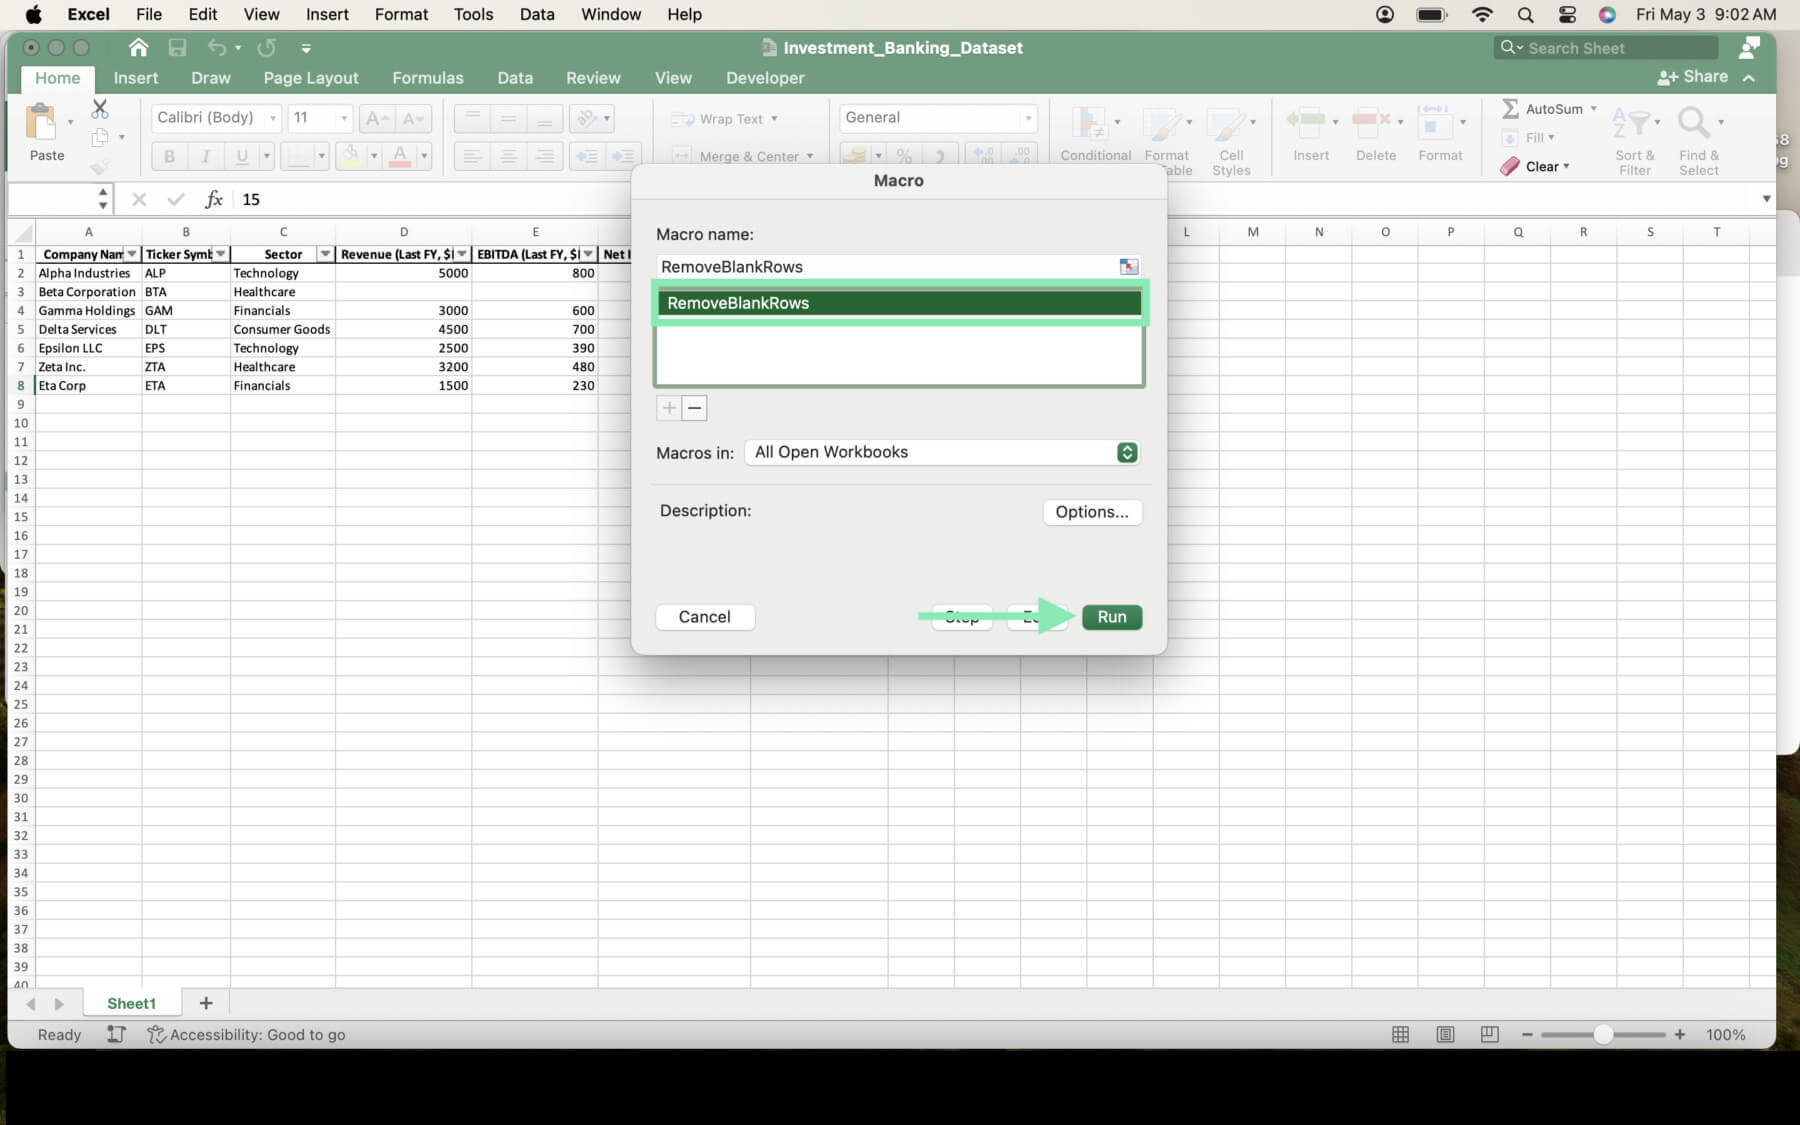
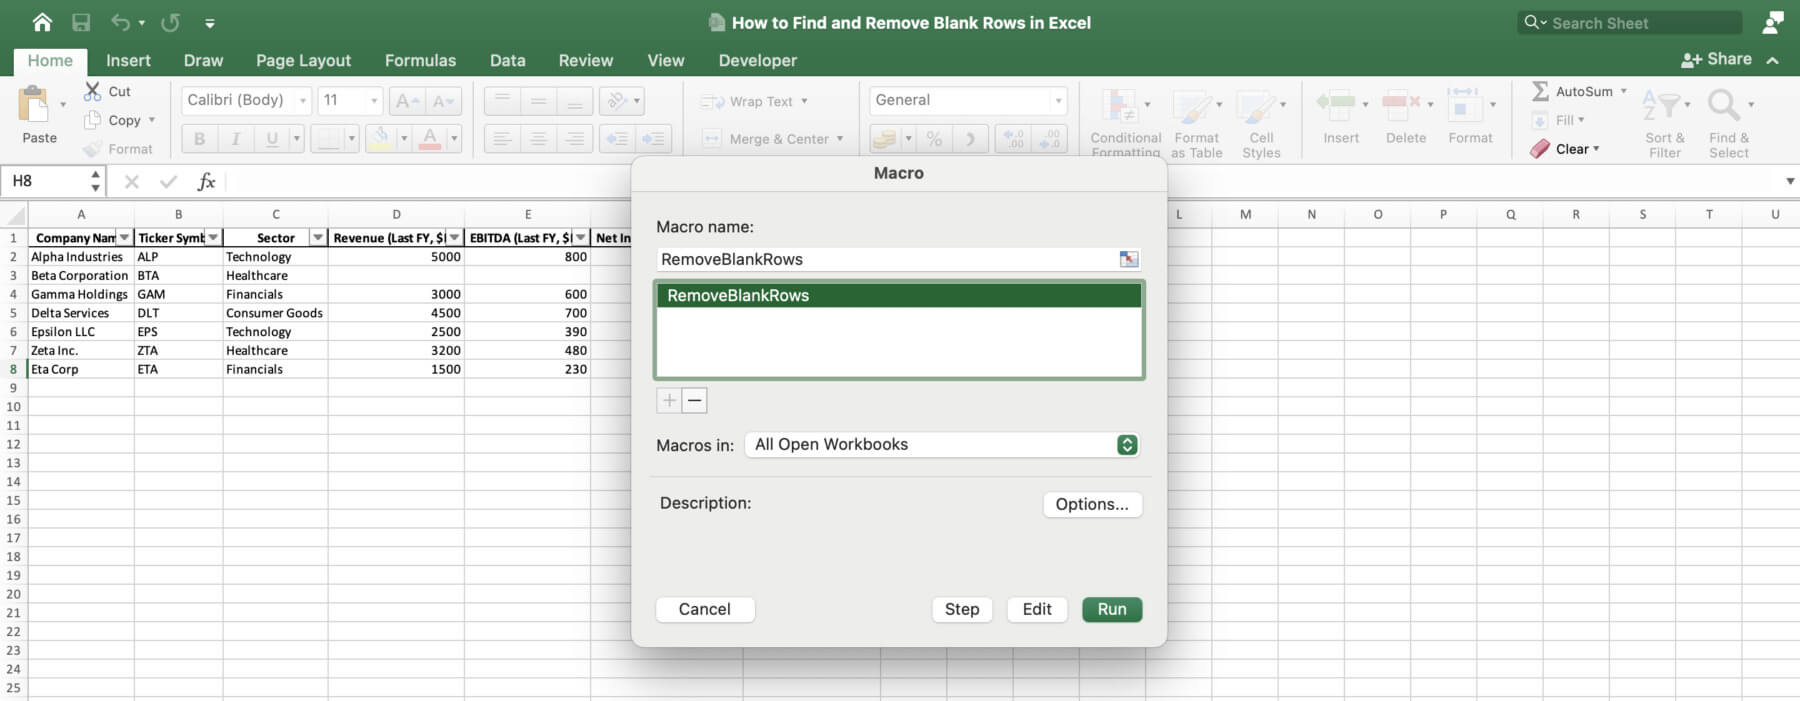
Step 6: Select ‘RemoveBlankRows’ and click ‘Run’.
Download Template

Download Template

Find and Remove Blank Rows

Try Macabacus for free to accelerate financial modeling in Excel.

Advanced Tips and Tricks

Here are a few advanced tips and tricks to keep in mind when working with rows in Excel:

Preventing Blank Rows in Future Data Entries

To reduce the occurrence of blank rows in your investment banking datasets, consider implementing data validation techniques. For example:

  • Use drop-down lists for fields with predefined options.
  • Set input messages to guide users on the expected format and value range.
  • Apply data validation rules to ensure that required fields are not left blank.

Common Pitfalls and How to Avoid Them

Check out some of the common pitfalls when removing blank rows so you can avoid them:

Data Loss

When removing blank rows, there’s a risk of inadvertently deleting rows that appear blank but contain hidden data, such as formulas or white-colored text. To avoid this:

  • Use the ‘Go To Special’ feature to identify truly blank cells rather than relying on visual inspection.
  • Double-check your dataset before making permanent deletions.
  • Always keep a backup of your original data.

Performance Issues

Extensive blank row cleanup can impact Excel’s performance, especially when dealing with large datasets. To minimize performance issues:

  • Use the VBA script or macro methods for faster processing.
  • If using filters, clear them after identifying and removing blank rows to improve spreadsheet responsiveness.
  • Consider breaking down your data into smaller, more manageable chunks.

Conclusion

Managing blank rows is an essential skill for investment bankers working with Excel to maintain data integrity and ensure accurate financial analysis. The various methods discussed above using a real-world investment banking dataset help you to efficiently identify and eliminate blank rows, facilitating more reliable and insightful financial evaluations.

To further enhance productivity and ensure consistency in financial documents, you can benefit from incorporating Macabacus. The tool streamlines Excel tasks such as formula auditing and spreadsheet formatting, which complement the strategies discussed for managing blank rows.

With Macabacus, you can not only expedite the removal of blank rows but also improve the overall efficiency of your financial modeling and analysis processes, ensuring you meet the highest standards of accuracy and professionalism.

Create Financial Models 10x Faster with Macabacus

Gain access to 100+ shortcuts, formula auditing visualizations, easy Excel-to-PowerPoint linking and productivity tools to help you accelerate financial modeling and presentations.

Discover more topics

Download The 2024 State of M&A Transactions
Download this report for expert guidance on innovative structures, cost-effective financing, and antitrust strategies to accelerate deals.
Read more
DCF Excel Template
Elevate your investment analysis with our free DCF model template. Understand discounted cash flow principles and perform accurate valuations in Excel.
Read more
Operating Model Excel Template
Download our free operating model Excel template. Forecast revenue, expenses, and key financial metrics for better decision-making.
Read more
LBO Excel Model
Try LBO modeling with our comprehensive Excel template. Understand key concepts, calculate returns, and gain actionable insights.
Read more