Print to PDF with Custom Settings
If you want more control over how your financial report appears in PDF format, use Excel’s ‘Print to PDF‘ feature instead of the export function.
Here’s how it works:
Step 1: Open the Excel file and go to the sheet you want to convert to PDF.
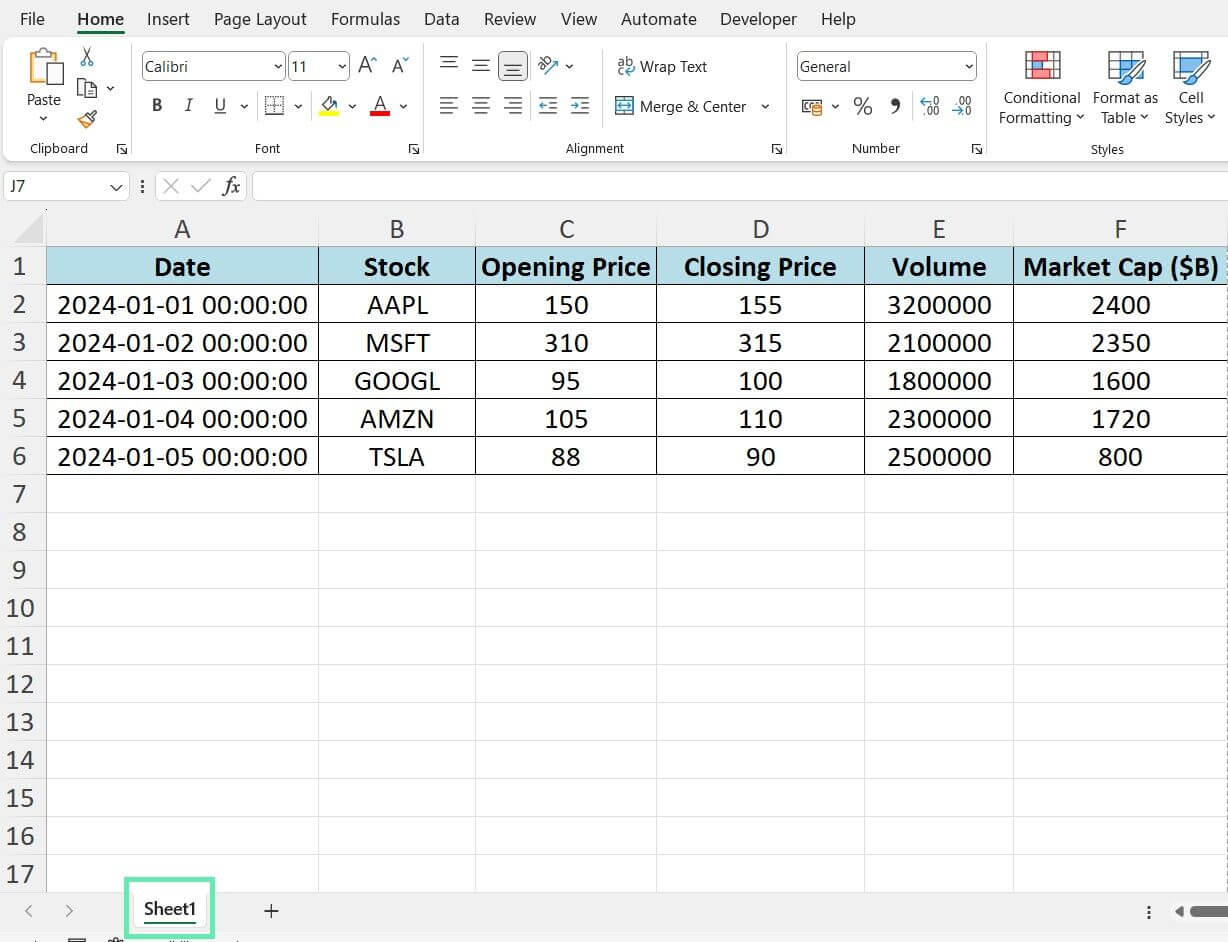
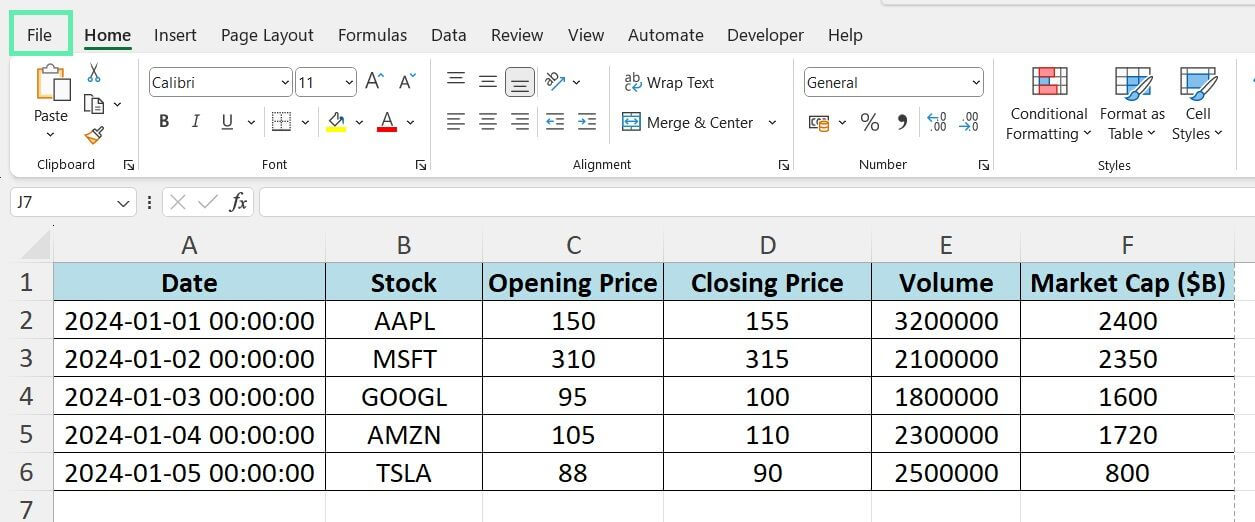
Step 2: Hit ‘File’ at the top-left of your screen.
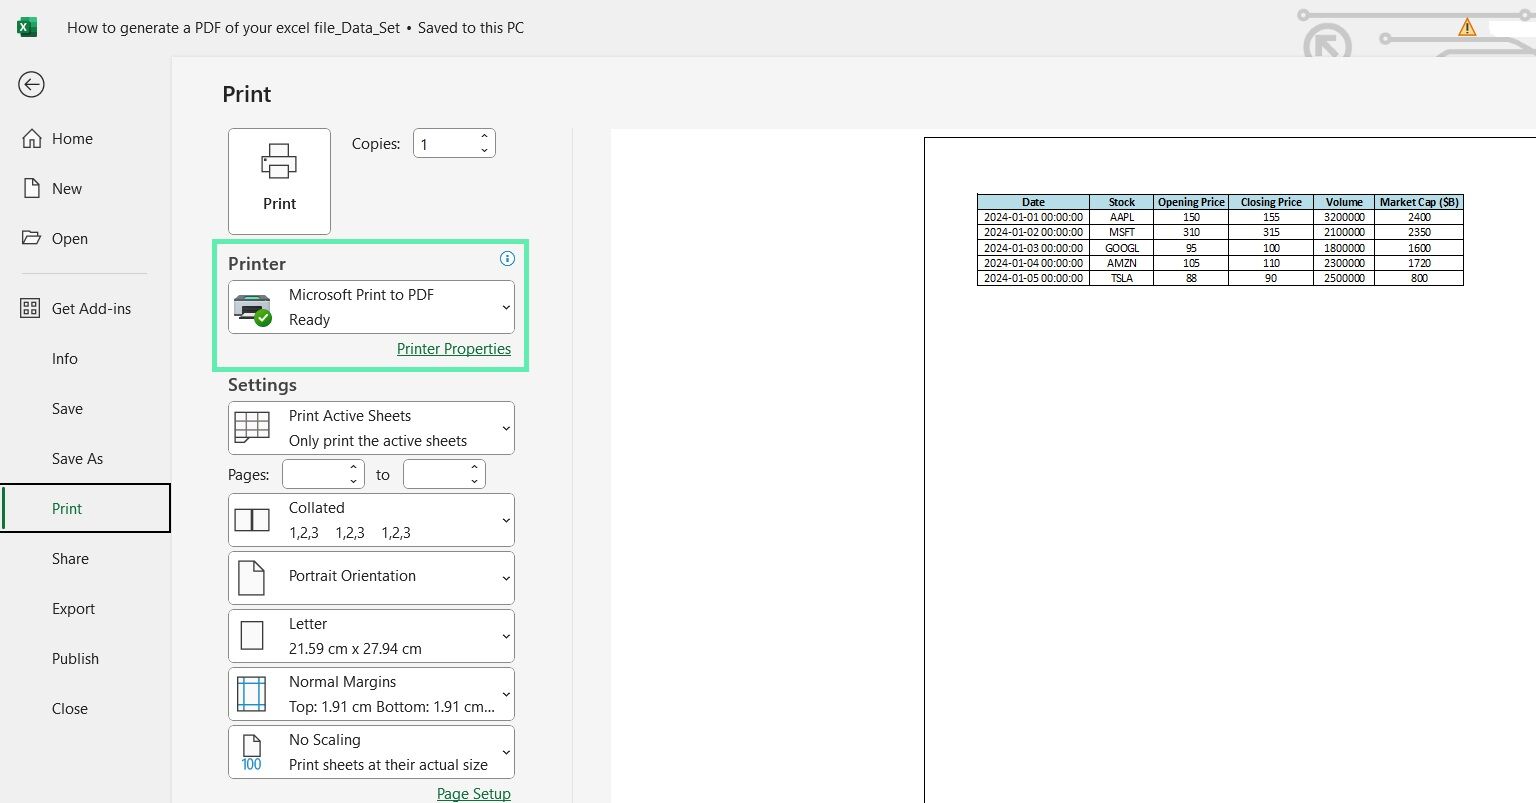
Step 3: Choose ‘Print’ from the menu.

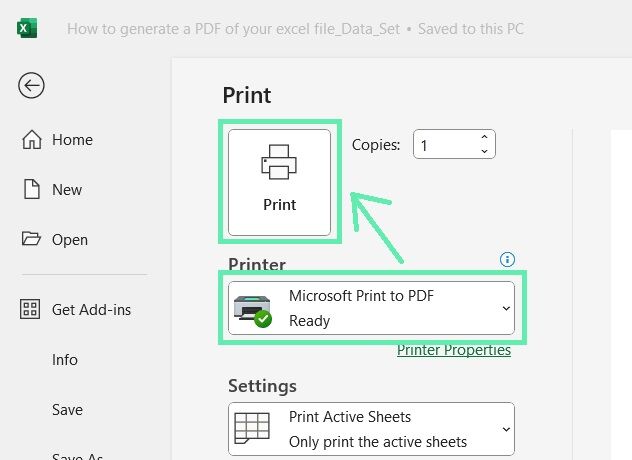
Step 4: Select ‘Microsoft Print to PDF’ under ‘Printer’.
Step 5: Hit ‘Print’.
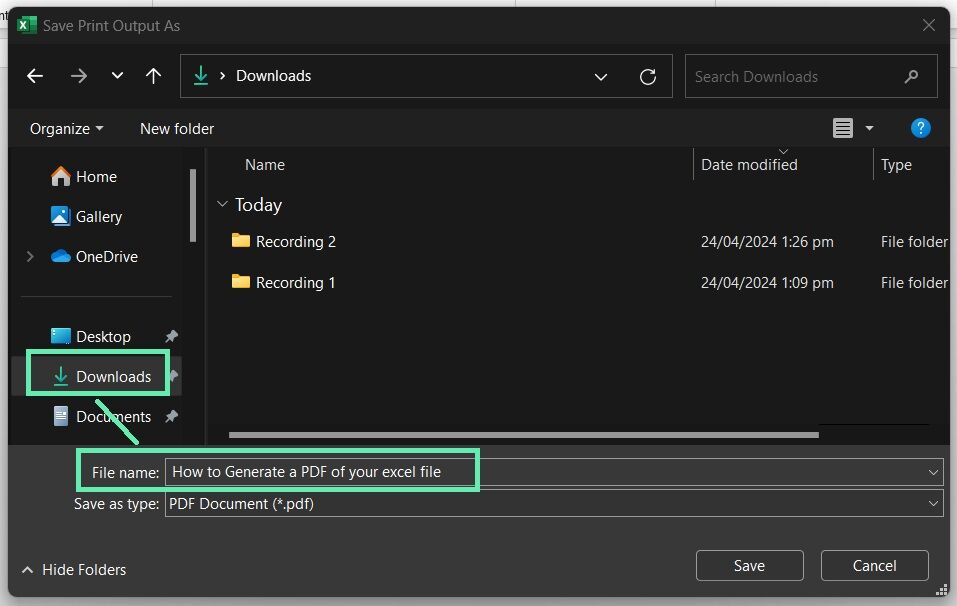
Step 6: Choose where to save your PDF and name it.
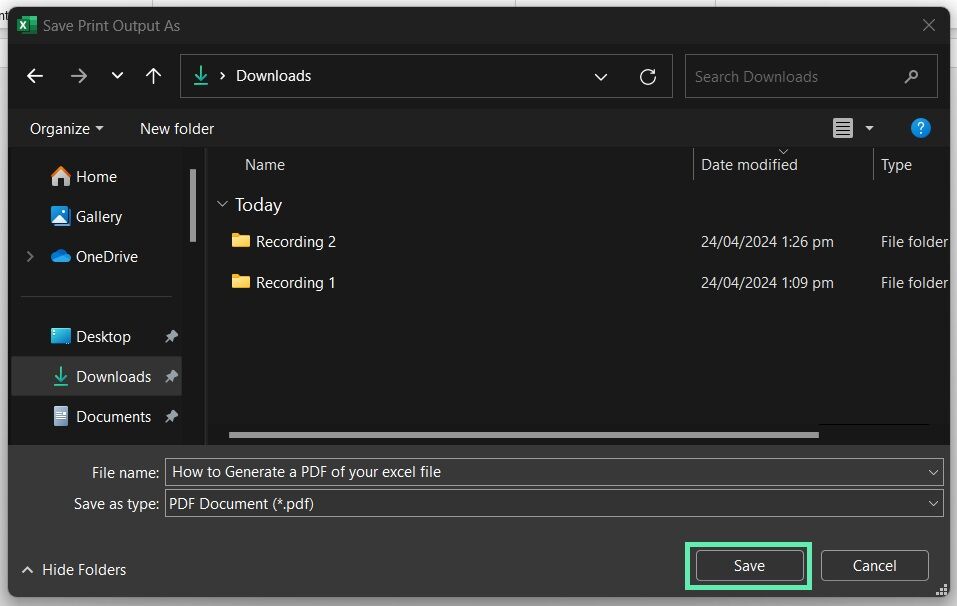
Step 7: Hit ‘Save’.
‘Print to PDF‘ lets you select what to print, such as a selected range, the active worksheet, or the entire workbook. You can also adjust other print settings to ensure your financial report looks as professional as possible.
You can adjust print settings such as orientation, margins, and scaling to give your financial report a professional look.
Advanced PDF Generation for Finance Professionals
In addition to generating PDFs, finance professionals can take advantage of Excel’s other useful features, such as creating charts and graphs.
Incorporating Visual Financial Data
While numbers and tables are essential in any financial report, sometimes, an image is worth a thousand words. That’s where charts and graphs come in.
Excel makes creating visual data representations straightforward, from simple line graphs to complex 3D pie charts. After you’ve created a chart or graph that effectively communicates your financial data, you can easily include it in your PDF report.
Here’s how:
Step 1: Select the chart or graph for your report.
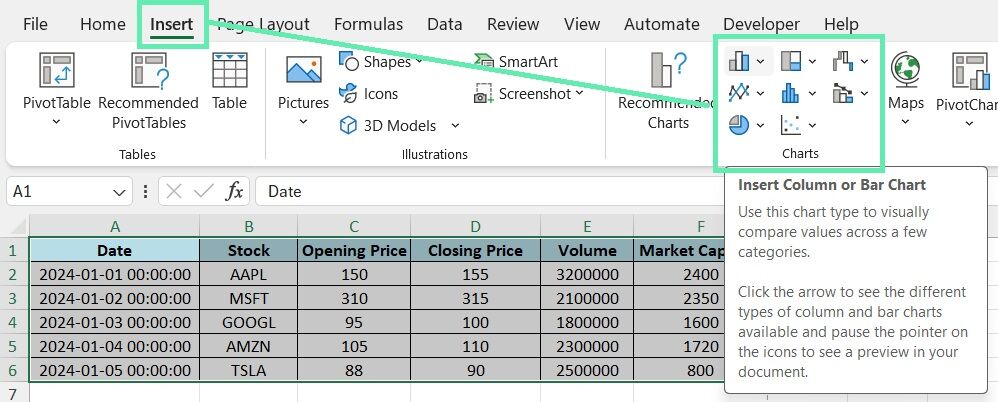
Step 2: Head over to the worksheet to add the chart or graph.

Step 3: Adjust the size and position of the chart or graph as needed.
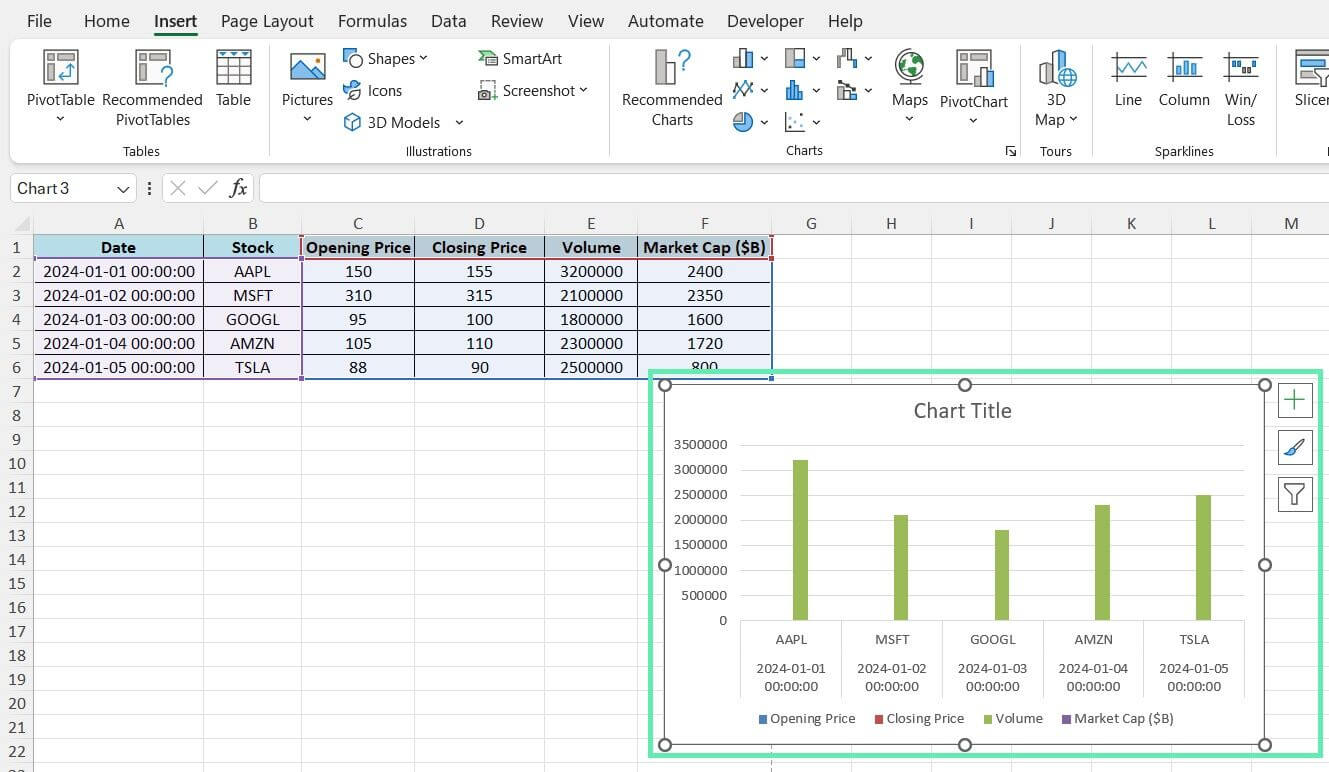
Pro Tip: Make sure that the visuals in your PDF are clear and impactful. Choose the right colors and fonts. Avoid putting too much info.
Automating Financial Report Updates
If you generate the same financial reports regularly, automating the process with Excel macros can save time and effort. Macros are small programs you can create within Excel to automate repetitive tasks.
Here’s an example of how you might use a macro to convert daily financial data to PDF automatically:
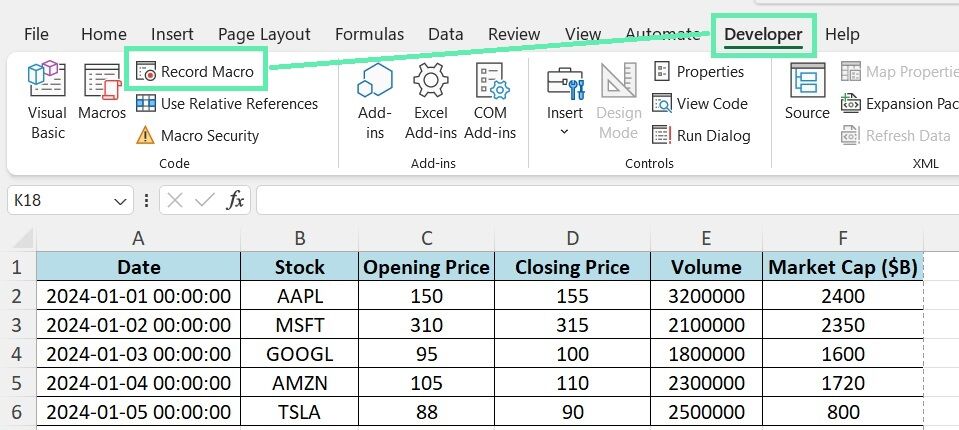
Step 1: Open a new Excel workbook and create a macro by clicking the ‘Developer’ tab and selecting ‘Record Macro’.
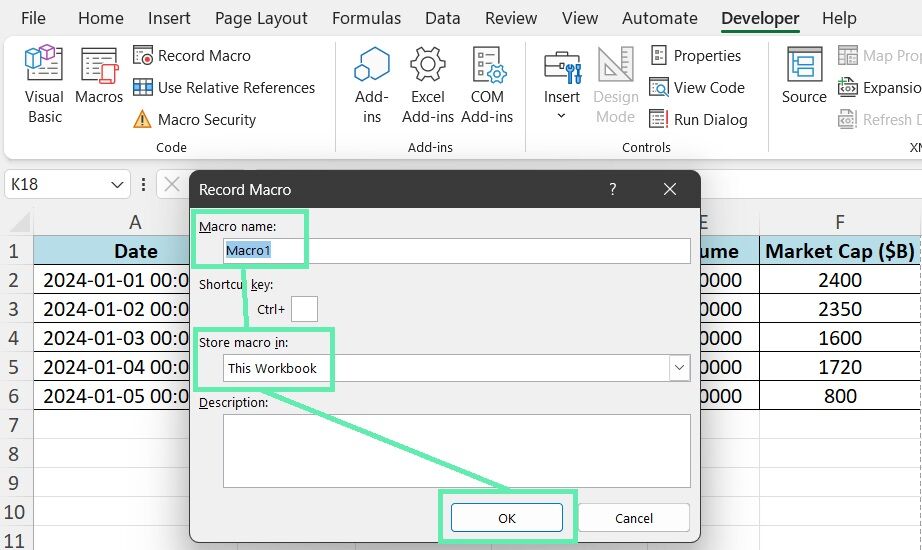
Step 2: Give your macro a name and choose where to store it.
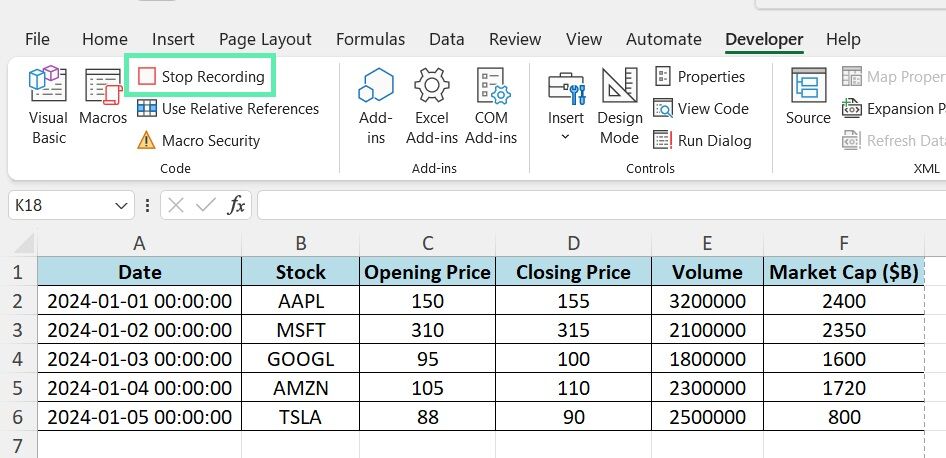
Step 3: Perform the steps you want to automate, such as importing your daily financial data and formatting it for reporting. When finished, click ‘Stop Recording’ to end the macro.
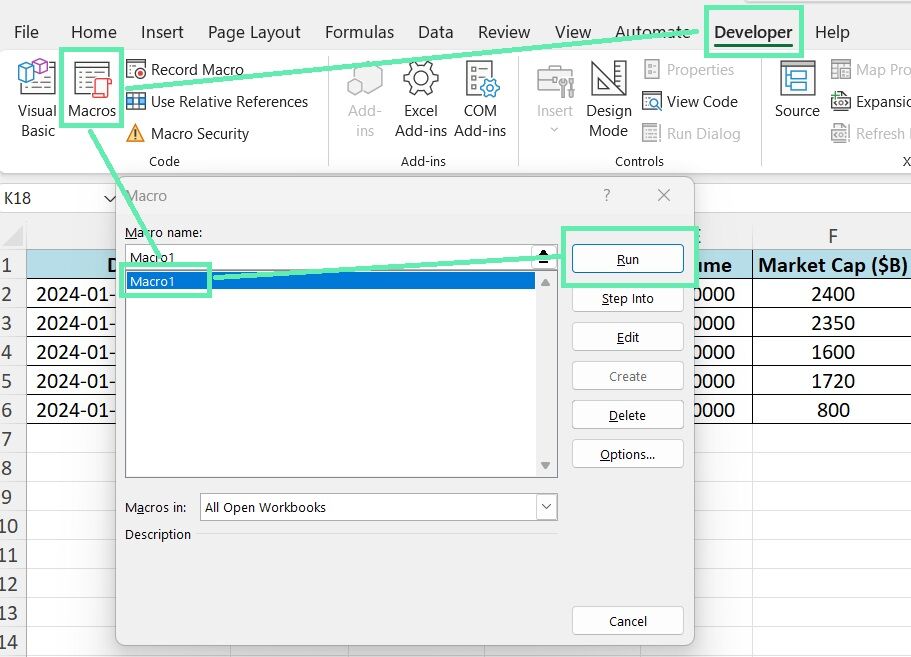
To run the macro in the future, open the workbook, click on the ‘Developer’ tab, select ‘Macros’, and select the one you created.
You can also set up scheduled tasks in Windows to automatically run your macro at a specific time each day, ensuring that your financial reports are always up-to-date.
Troubleshooting Common Issues in Financial Reports
Here are a few tips to help resolve common issues when preparing financial reports:
Addressing Format and Alignment Issues
You may encounter formatting and alignment issues when transferring financial data from Excel to PDF despite thorough preparation. Below are some suggestions for addressing such issues:
- To address misaligned numbers in the PDF, adjust the column widths in your Excel sheet to provide adequate space for each value.
- In Excel, ensure headers or footers are positioned close enough to the page’s edge to prevent them from being truncated in the PDF.
- If cell borders or shading appear incorrectly in the PDF, experiment with alternative border styles or lighter colors in Excel.
Managing Large Financial Datasets
Excel can be tricky with large financial datasets, especially for PDF reports. A big spreadsheet might take ages to convert to PDF or be too large to share.
Here’s how to handle big datasets without slowing down Excel:
- Use Pivot Tables and filters in Excel to quickly summarize and analyze data.
- To manage file sizes, consider splitting your data across more sheets or books.
- Use a macro to save time when making many PDF reports from one dataset.
Conclusion
In this blog post, we delved into various techniques for generating high-quality PDF reports from Excel, focusing on financial data. From straightforward exporting and printing methods to more sophisticated approaches involving visual data enhancements and automated report updates, there are many options to ensure your financial reports are professional and communicative.
Taking the time to meticulously prepare your data, optimize your report layouts, and resolve common issues can significantly improve how you present your financial insights to stakeholders and clients. Why not implement the abovementioned strategies today and observe the impact on your reporting processes?
Remember, mastering PDF creation from Excel comes with practice. The more you engage with the above methods, the more proficient you’ll become. Moreover, your journey toward efficiency might even lead you to discover innovative techniques that can transform your workflow.
For those looking to streamline this process even further, Macabacus offers a suite of tools designed to enhance your productivity across Microsoft Office applications. Tailored specifically for finance and banking professionals, Macabacus helps format spreadsheets and audit formulas and seamlessly integrates Excel with PowerPoint and Word to maintain consistency and accuracy across documents. Embracing Macabacus could be your next step toward more efficient and effective financial reporting.


