Using Basic INDEX-MATCH Excel Formula
We can achieve remarkable results when we use INDEX and MATCH functions together.
=INDEX(data_range, MATCH(lookup_value, lookup_range, 0))
How to Find the Market Cap of “Beta Limited” Using INDEX-MATCH
Step 1: Find the row number of ‘Beta Limited’ using MATCH:
=MATCH(“Beta Limited”, B2:B6, 0)
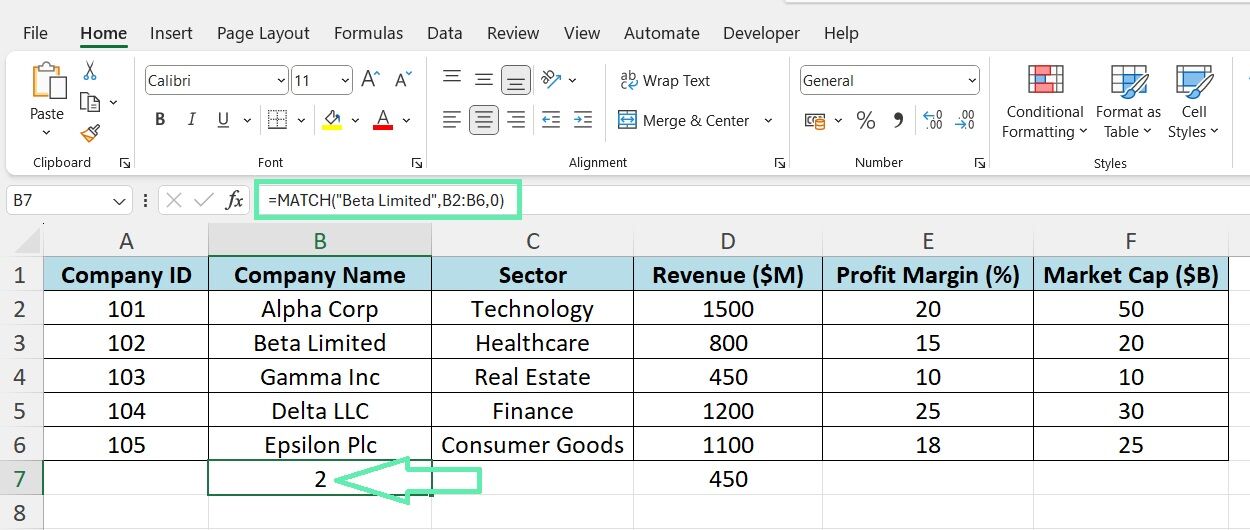
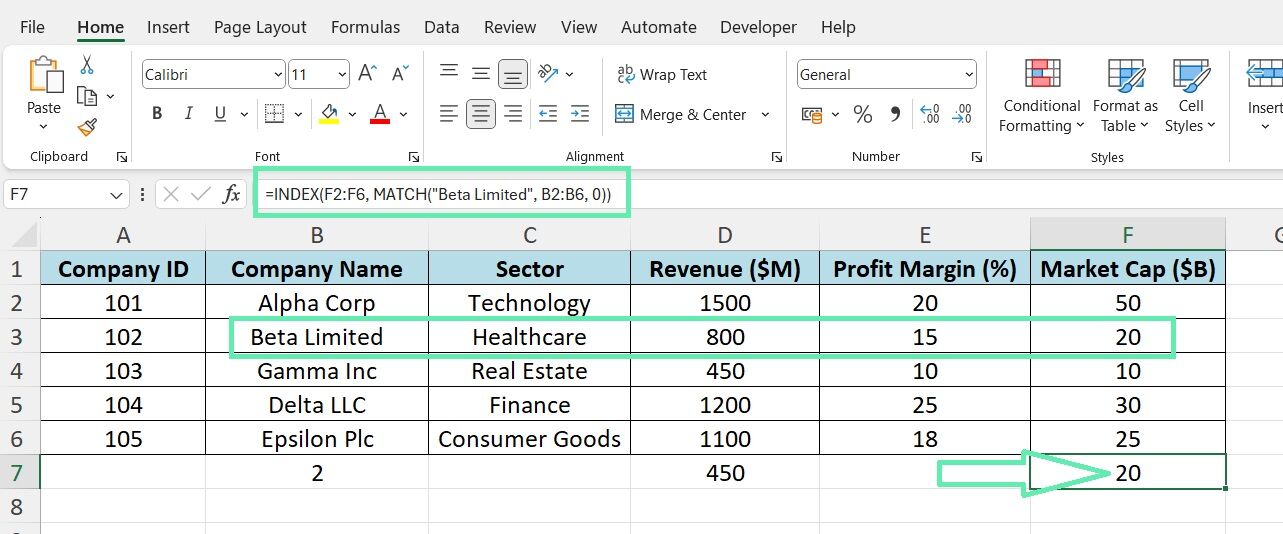
Step 2: Specify the Market Cap column as the data_range using the INDEX function:
=INDEX(F2:F6, MATCH(“Beta Limited”, B2:B6, 0))
Advanced Financial Analysis Techniques
Multi-Column Financial Lookup
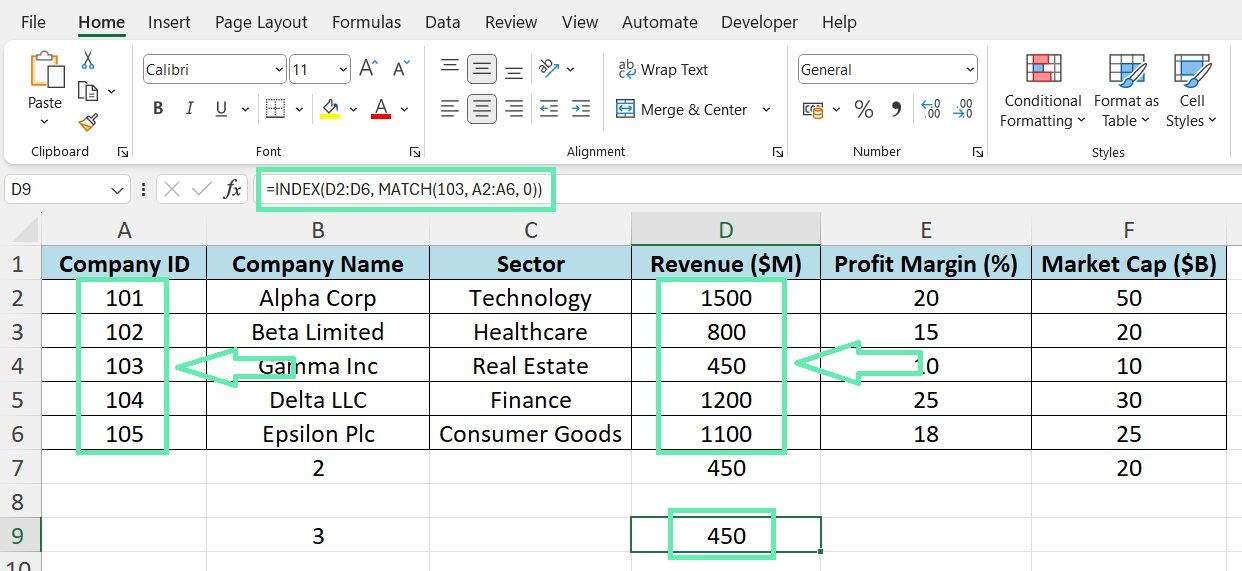
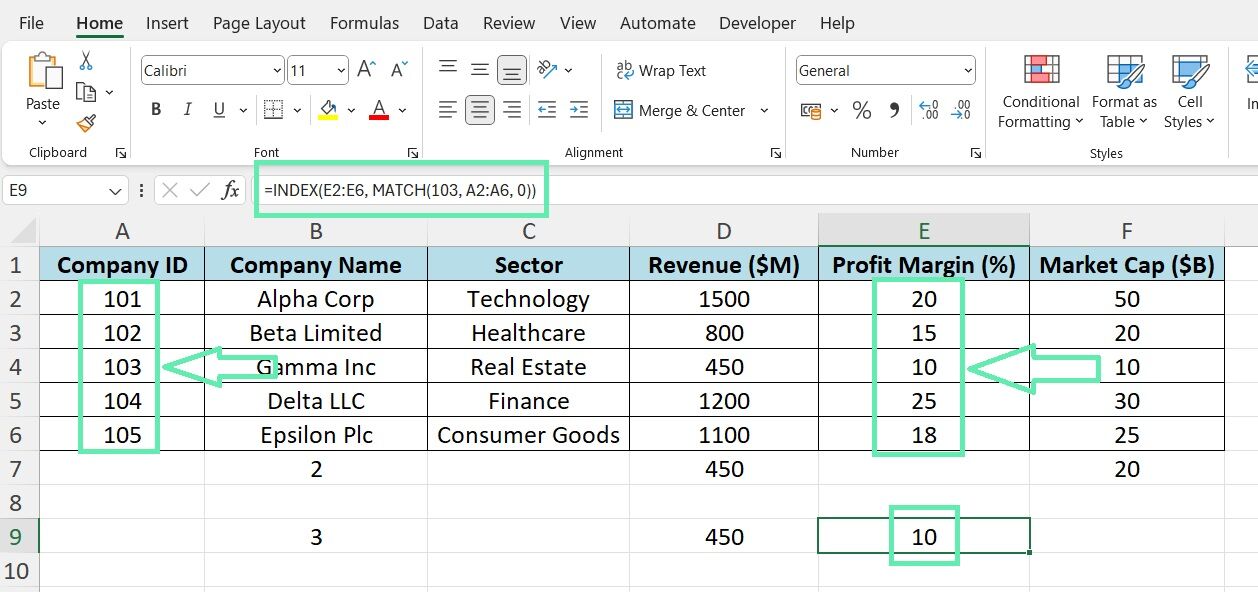
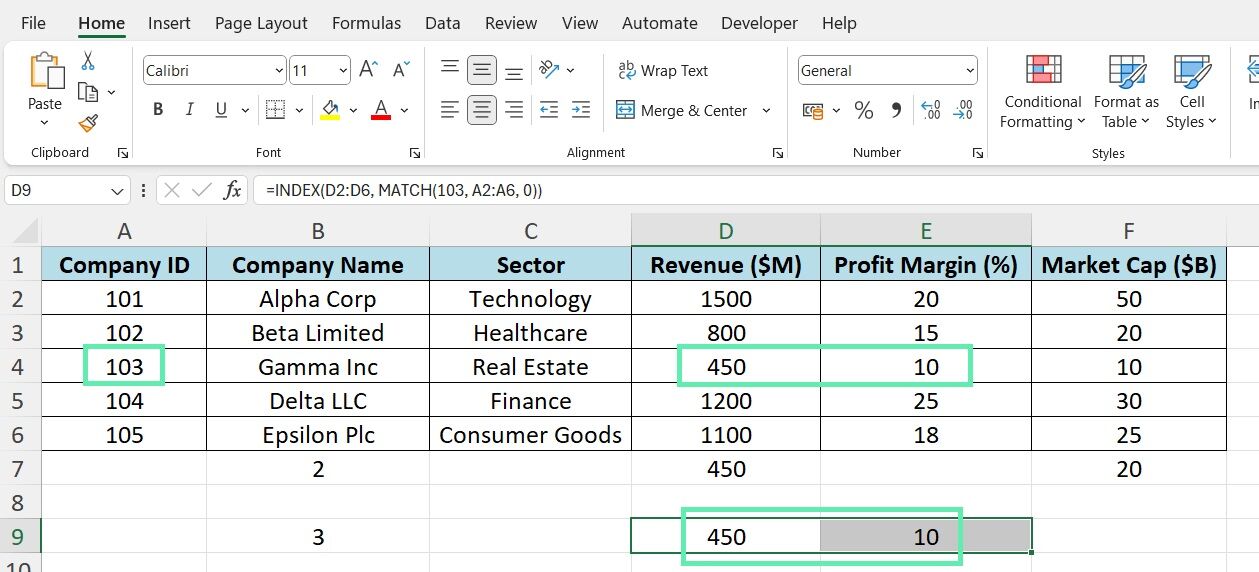
Investment bankers often need to retrieve data across multiple financial metrics. INDEX-MATCH makes this a breeze. Let’s say you want to find both the ‘Revenue’ and ‘Profit Margin’ for a company with ID ‘103′.
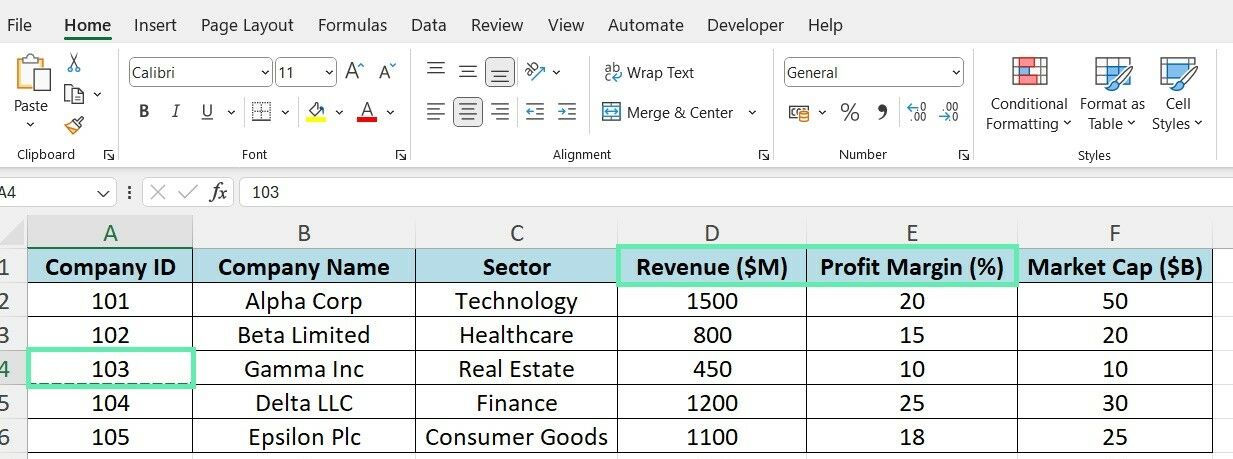
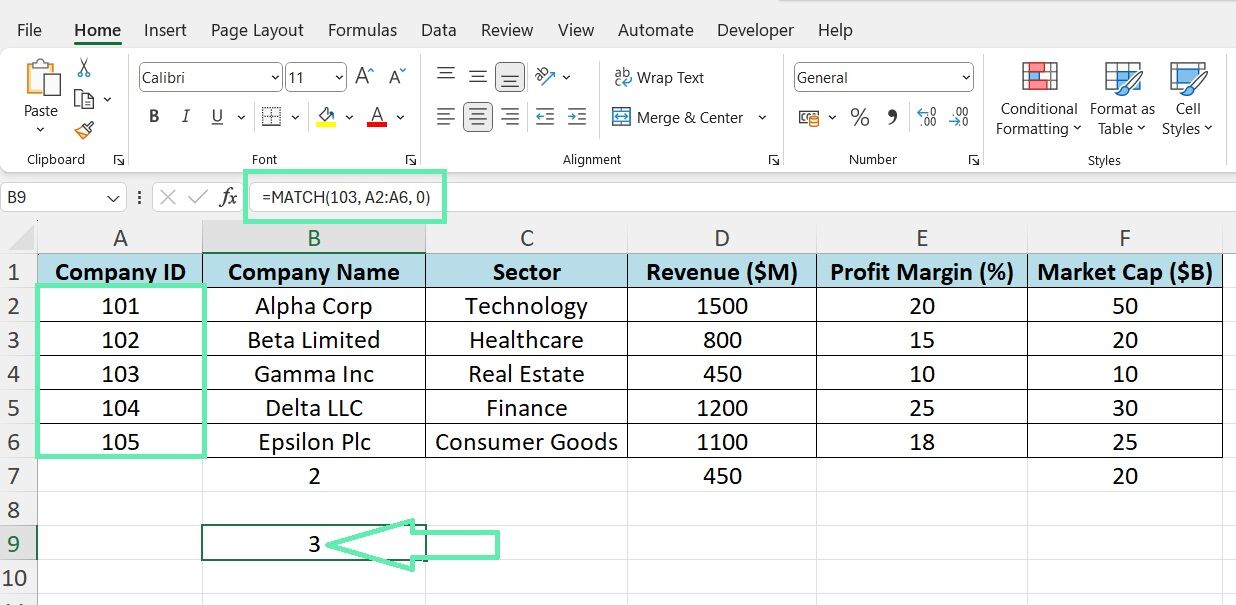
Step 1: Set up the MATCH part to find the row number based on the Company ID:
=MATCH(103, A2:A6, 0)
Step 2: Use INDEX to retrieve Revenue and Profit Margin, referencing the MATCH result:
Revenue: =INDEX(D2:D6, MATCH(103, A2:A6, 0))
Profit Margin: =INDEX(E2:E6, MATCH(103, A2:A6, 0))
By using the same MATCH formula for both INDEX functions, you ensure that the retrieved values are from the same company.
Error Handling in Financial Models
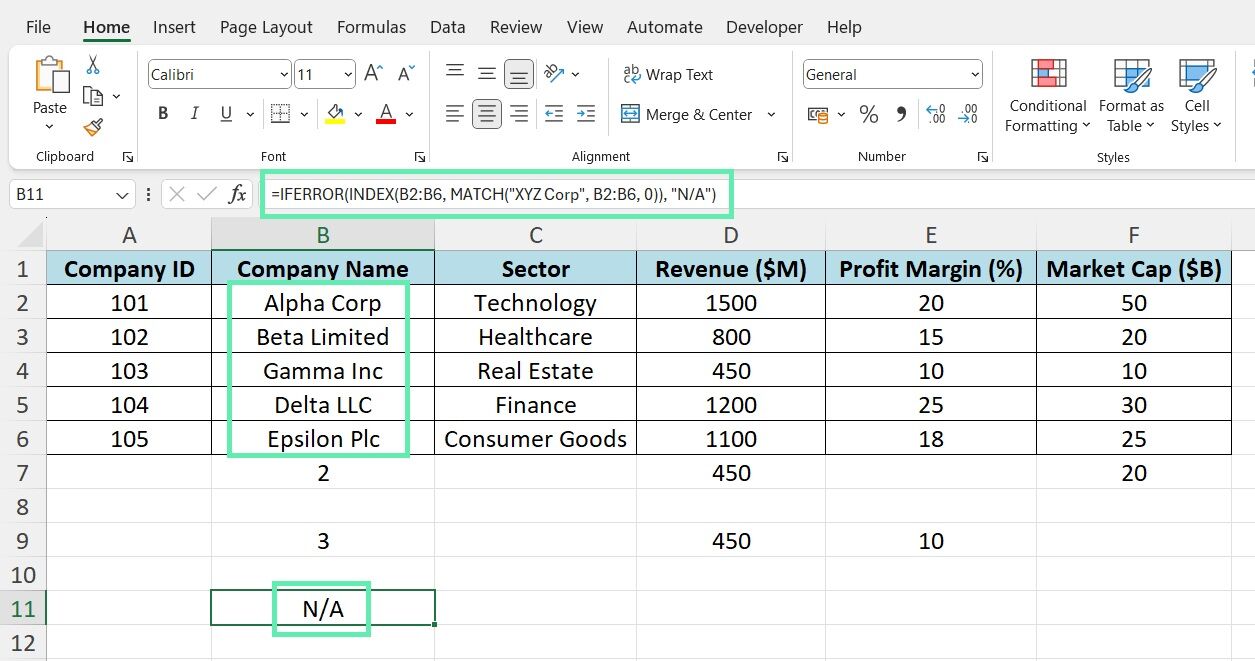
When modeling finances, you have to handle errors smoothly. What if the company isn’t in the dataset? That’s where IFERROR comes in.
Use IFERROR around your INDEX-MATCH. Add a default error value:
=IFERROR(INDEX(B2:B6, MATCH(“XYZ Corp”, A2:A10, 0)), “N/A”)
If we can’t find ‘XYZ Corp,’ you’ll see ‘N/A‘ and not an error.
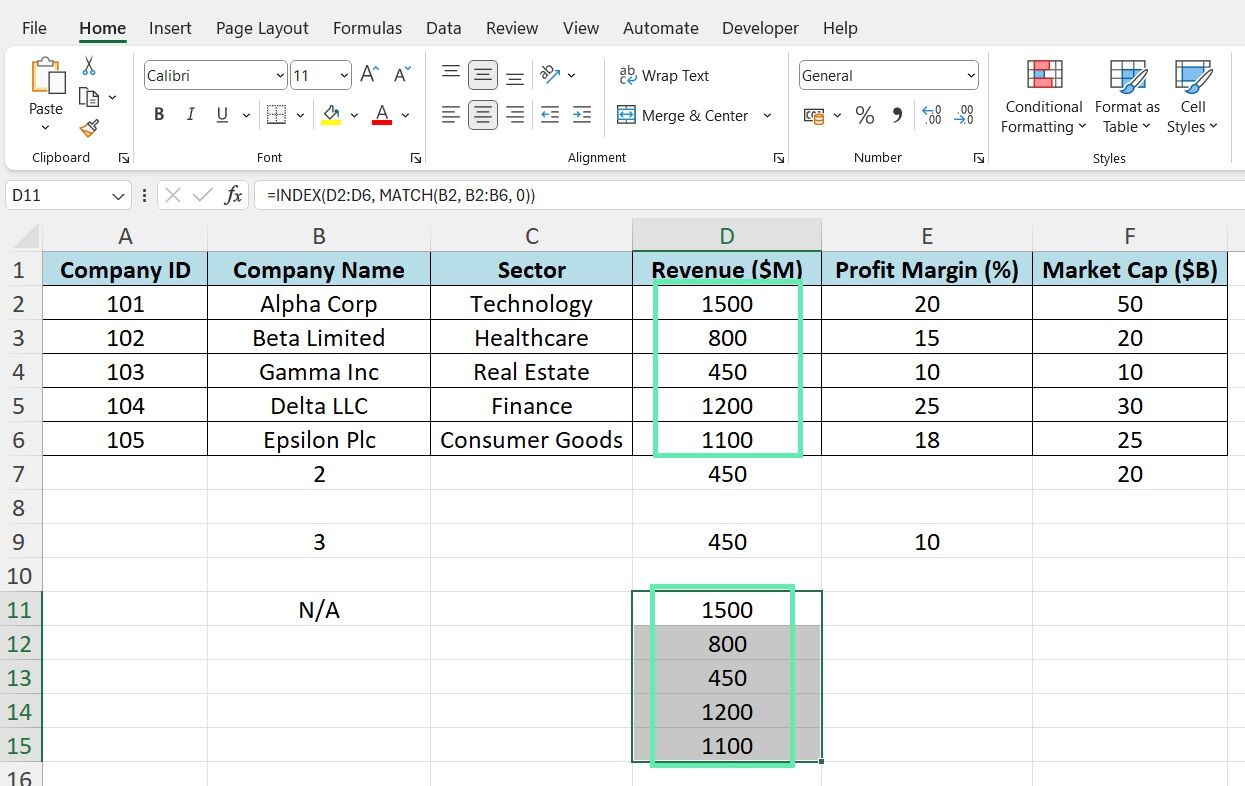
Need financial data for many companies? Array formulas to the rescue. Say you’ve got company names in B2:B6 and need their revenues.
Step 1: Set up INDEX-MATCH for the first company:
=INDEX(D2:D6, MATCH(B2, B2:B6, 0))
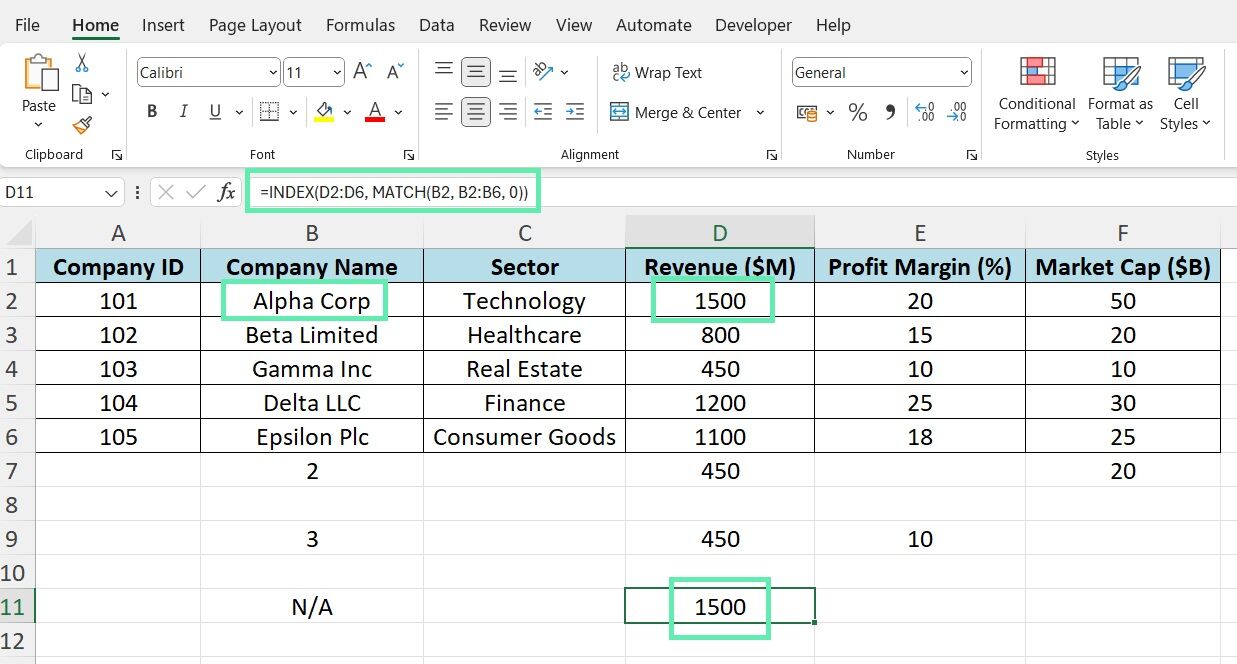
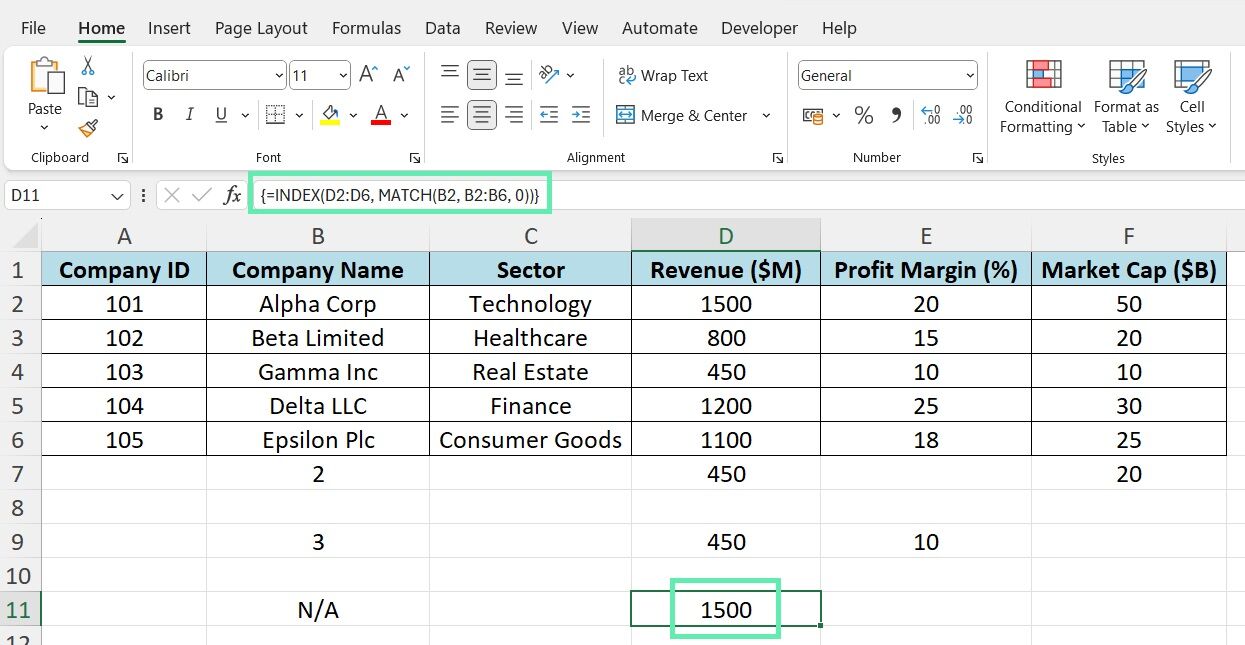
Step 2: Hit ‘Ctrl + Shift + Enter’ to make it an array formula. You’ll see curly braces:
=INDEX(D2:D6, MATCH(B2, B2:B6, 0))
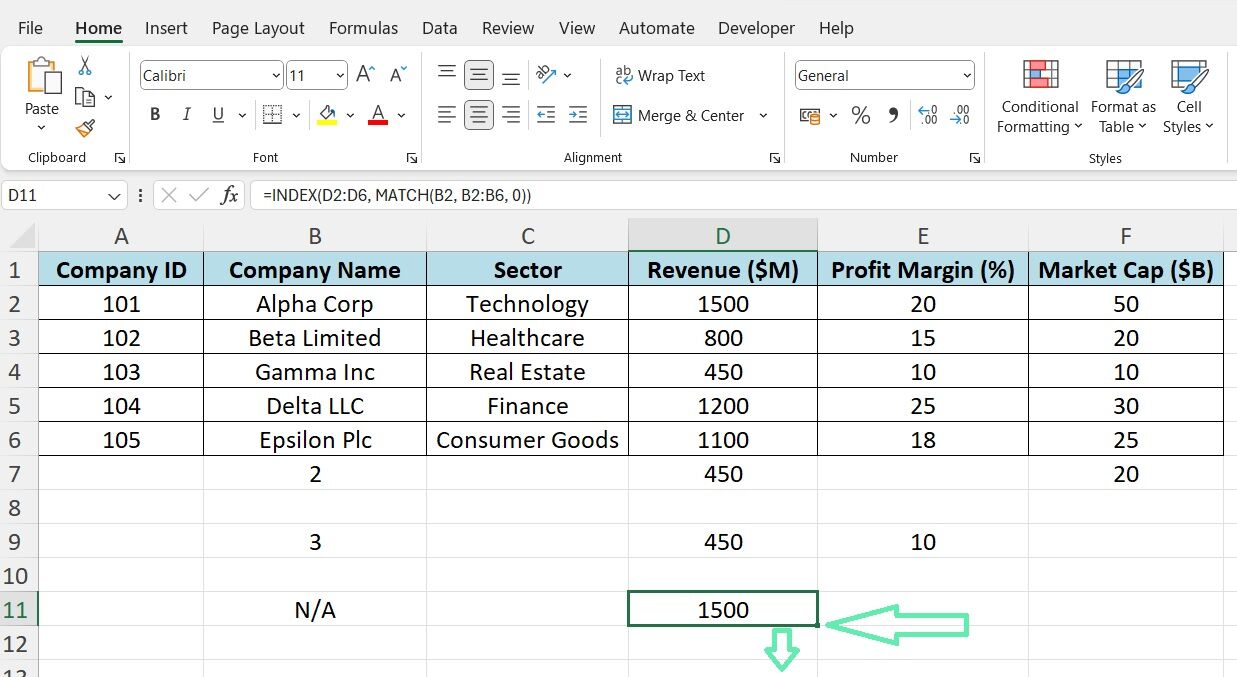
Step 3: Drag the formula down. Excel updates the company names for you.
Array formulas get each company’s revenue in one shot.
Optimizing INDEX-MATCH for Large Financial Models
Enhancing Performance
Optimizing your INDEX-MATCH formulas is essential for maintaining performance when working with large financial models. Here are some tips:
- Narrow down the lookup_range to the smallest possible size. Instead of searching the entire column, use a specific range like A2:A1000.
- Avoid using whole-column references (e.g., A:A) in your MATCH function, as it can slow down calculations.
- If you’re using array formulas, be mindful of the size of your datasets. Using too many array formulas in large models can impact performance.
Integrating with Financial Formulas
INDEX-MATCH integrates with other financial functions, allowing for dynamic and efficient financial analysis. It can be combined with XIRR to calculate an investment’s IRR.
=XIRR(INDEX(CashFlows, MATCH(“Investment XYZ”, Investments, 0)))
The above formula retrieves the “Investment XYZ” cash flows using INDEX-MATCH and passes them to the XIRR function to calculate the IRR.
Similarly, you can use INDEX-MATCH with functions like NPV (Net Present Value) and PMT (Payment) to perform dynamic financial calculations based on specific criteria.
Common Pitfalls in Financial Data Retrieval
Even seasoned finance professionals can stumble when using INDEX-MATCH. Here are some common pitfalls to watch out for:
- Mismatched data types: Ensure that the lookup_value and the lookup_range have the same data type (e.g., text, numbers). Mismatches can lead to incorrect results or #N/A errors.
- Not using absolute references: When dragging formulas, use absolute references ($) for the lookup_range to maintain consistency.
- Forgetting to use the 0 match_type: If you want an exact match, always specify 0 as the match_type. Omitting it can lead to unexpected results.
- Not handling errors: Always anticipate and handle potential errors using IFERROR to prevent your financial models from breaking.
If you encounter issues, double-check first your references and data types. If the problem persists, try breaking down your INDEX-MATCH formula into smaller parts to isolate the issue.
Conclusion
INDEX-MATCH is a game-changer for financial analysts and investment bankers. By mastering the said functions, you’ll unlock new levels of efficiency and accuracy in your financial models. The ability to retrieve specific data points, handle errors, and integrate with other financial formulas will set you apart in the fast-paced world of finance.
As you hone your skills, consider enhancing your productivity with Macabacus to streamline your Microsoft Office workflow, allowing you to focus more on analysis and less on the process. Whether you’re formatting spreadsheets, auditing formulas, or creating presentations, Macabacus ensures precision and brand compliance at all times.
Start incorporating INDEX-MATCH into your daily workflow, and explore how Macabacus can support your financial modeling needs. Happy modeling, and may your financial analysis be precise and efficient!


