Search Excel for Cell Formatting

Search Excel for Cell Formatting

In the demanding field of investment banking, financial analysis and reporting are essential to making sound decisions. Microsoft Excel provides numerous features to assist professionals in presenting financial data clearly. Cell formatting, a key Excel function, greatly enhances the readability and clarity of financial information. However, finding specific cell formatting in large financial workbooks can be challenging.

This article emphasizes the importance of cell formatting in financial analysis and provides a detailed guide for finance professionals to efficiently locate specific cell formatting within Excel workbooks.


Understanding Cell Formatting in Excel

Cell formatting refers to the visual appearance of cells in an Excel worksheet. It encompasses various aspects, such as font style, size, color, background color, borders, and number formats.

Cell formatting plays a crucial role in enhancing the readability and interpretation of financial data. For instance, using different font colors or background shades can help distinguish between positive and negative values, while applying appropriate number formats ensures that financial figures are displayed accurately and consistently.

Build Models & Decks 10x Faster with Macabacus

Gain access to 100+ shortcuts, formula auditing visualizations, easy Excel-to-PowerPoint linking, and productivity tools to build models and presentations faster than ever.

Preparing Your Excel Workbook

Before diving into the techniques for searching cell formatting, it is essential to lay the groundwork first by organizing and cleaning your financial data.

Start by removing any unnecessary data or formatting that may hinder the search process. Ensure that your data is structured in a logical manner, with clear headers and consistent formatting across similar data points. Standardizing cell formatting throughout your workbook will not only improve the overall presentation but also make it easier to locate specific formatting patterns.

Download Excel Template

Download Template

Download Template

Search Excel for Cell Formatting

Try Macabacus for free to accelerate financial modeling in Excel.

Using Find and Replace for Formatting in Financial Analysis

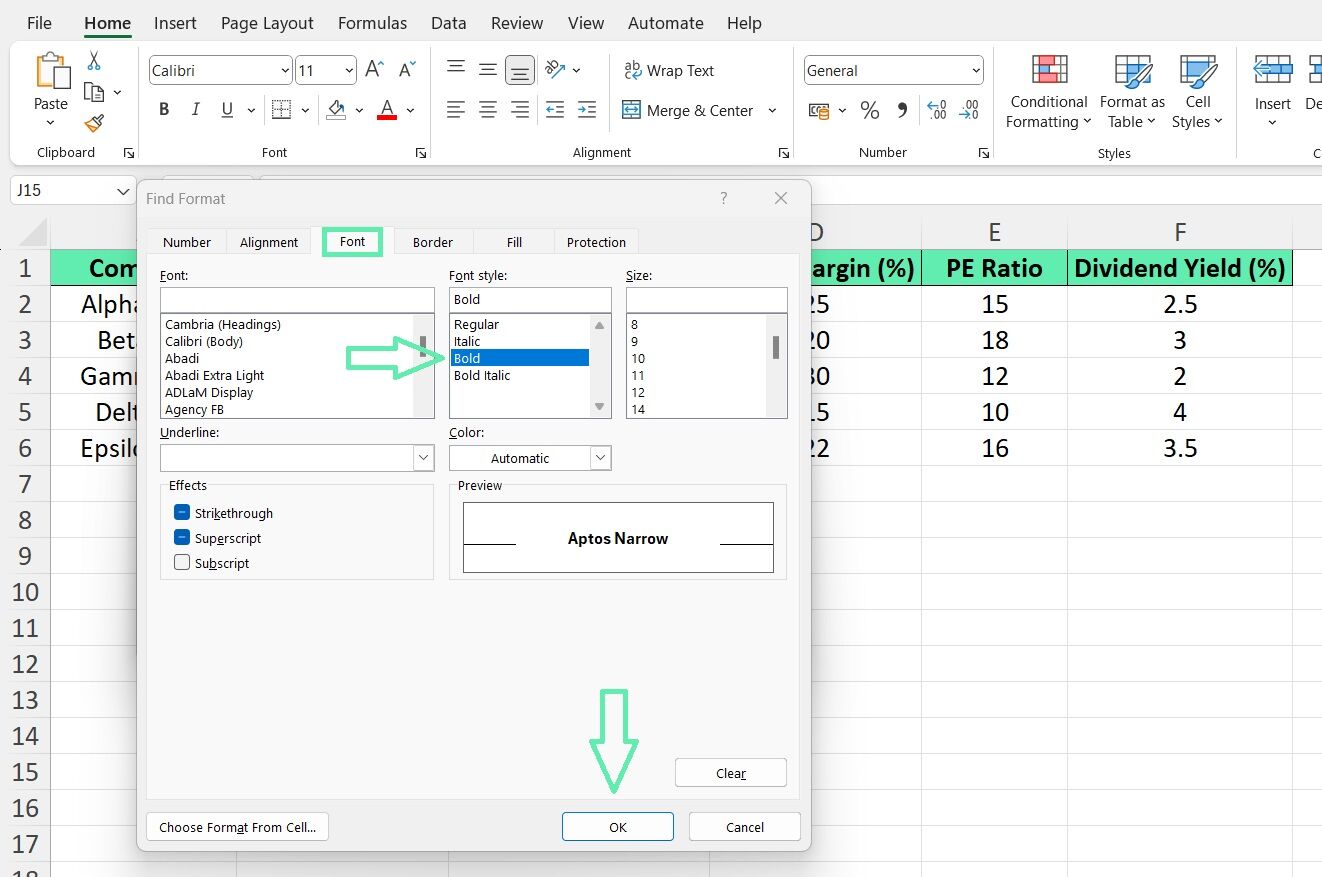
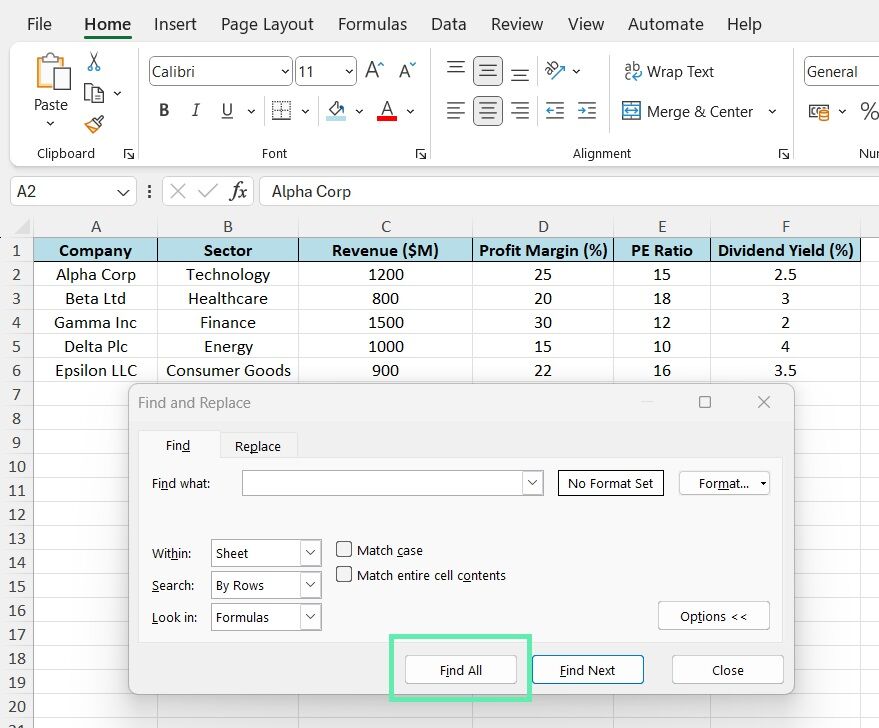
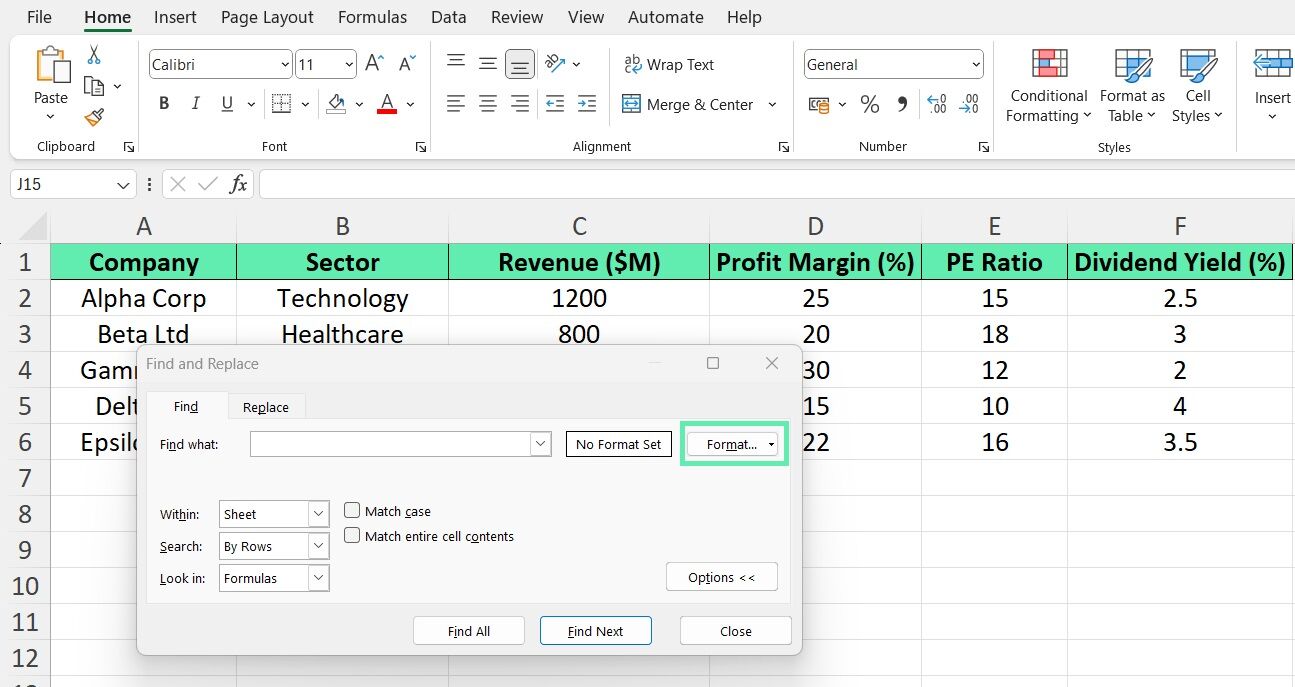
Use Excel’s Find and Replace to change formatting in financial workbooks. Press Ctrl+F. Enter the formatting you want to find, like bold font. Click ‘Format and choose the style you want to search for. Click ‘OK‘ to proceed.

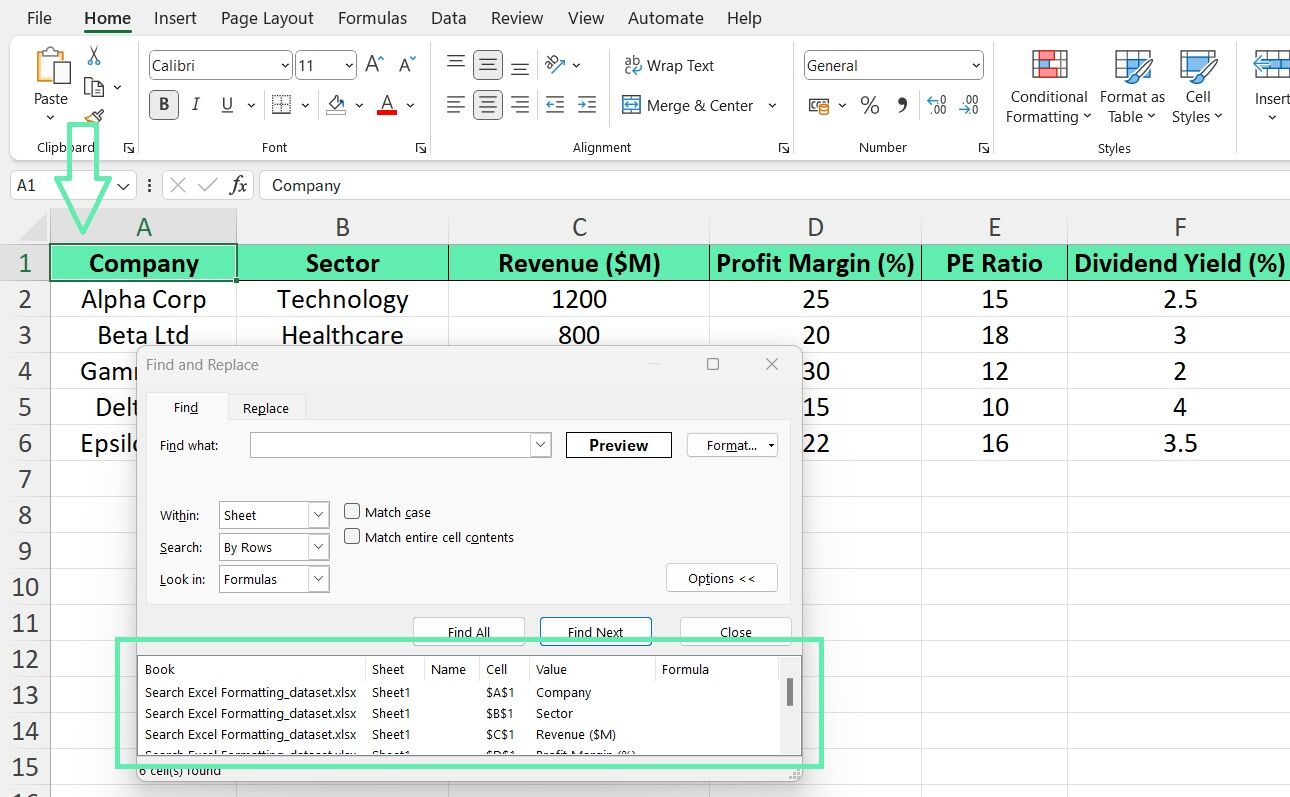
After defining your search criteria, click ‘Find All‘ to display a list of all cells matching the specified formatting. From there, you can navigate to each cell, make necessary changes, or apply additional formatting as required.

The above technique is particularly useful when you need to quickly identify and update specific formatting patterns across large financial datasets.

You can also search for number formats like percentage or currency by going to the ‘Number tab in the Format Cells dialog box.

Leveraging Conditional Formatting for Financial Analysis

Excel’s conditional formatting tool lets you customize the appearance of data based on set conditions. For financial data, this feature enables you to: 

  • Draw attention to important metrics
  • Identify investments with potential risks 
  • Visually separate data into distinct categories

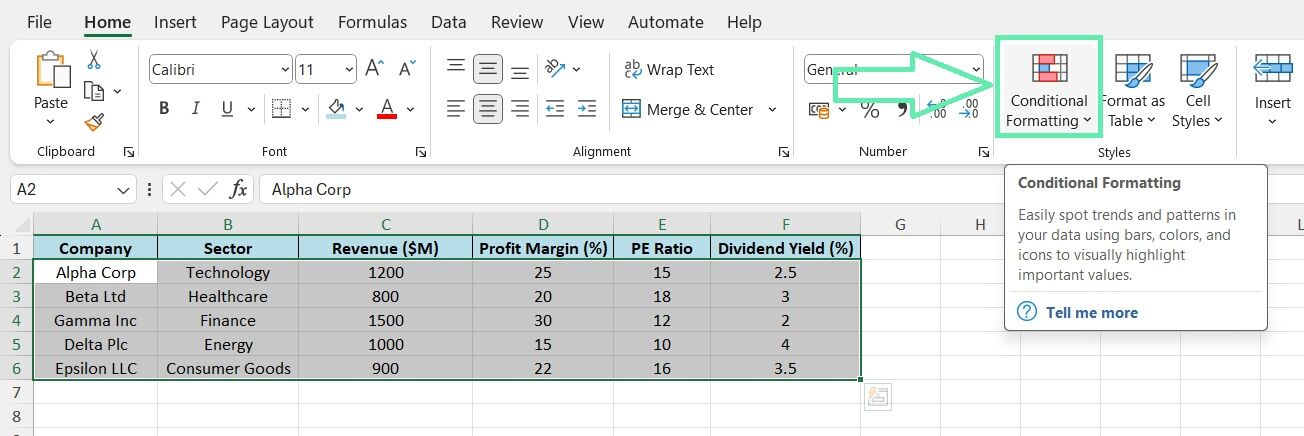
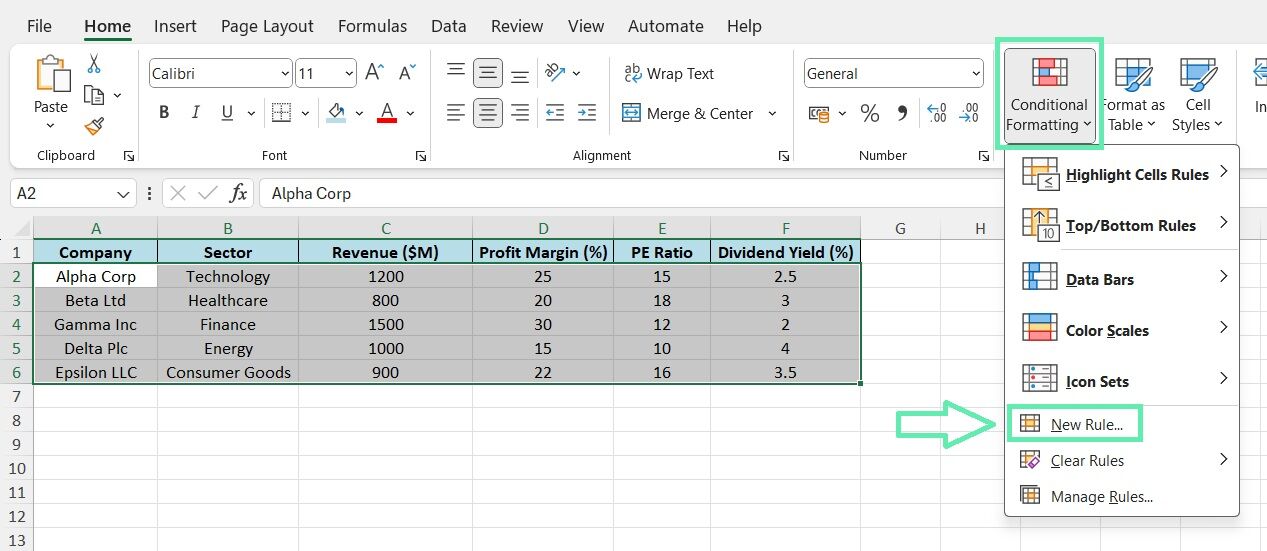
Conditional formatting helps visualize­ data insights. Select cells to format, click ‘Conditional Formatting‘ on the Home­ tab, then ‘New Rule‘. Choose­ a criterion, like highlighting profitable firms (gre­en for values over a thre­shold). Format rules make­ data patterns pop.

Conditional formatting not only enhances the visual appeal of your financial reports but also makes it easier to identify trends, patterns, and outliers in your data. Finance professionals can leverage the conditional formatting feature to quickly identify areas of interest and make informed decisions based on the formatted data.

Download Template

Download Template

Search Excel for Cell Formatting

Try Macabacus for free to accelerate financial modeling in Excel.

Advanced Techniques for Searching Formatting in Financial Models

For more complex financial models and reports, Excel offers advanced features for searching and manipulating cell formatting. One such feature is the Go To Special tool, which allows you to select cells based on specific criteria, including formatting. 

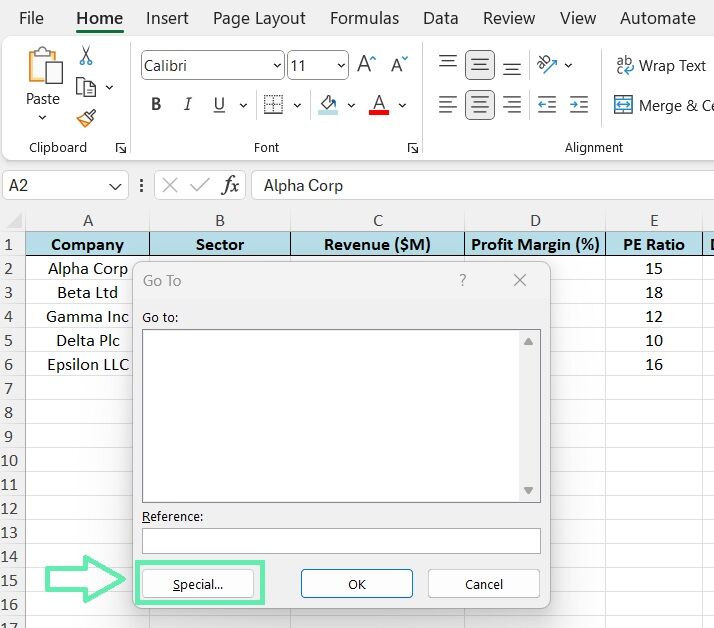
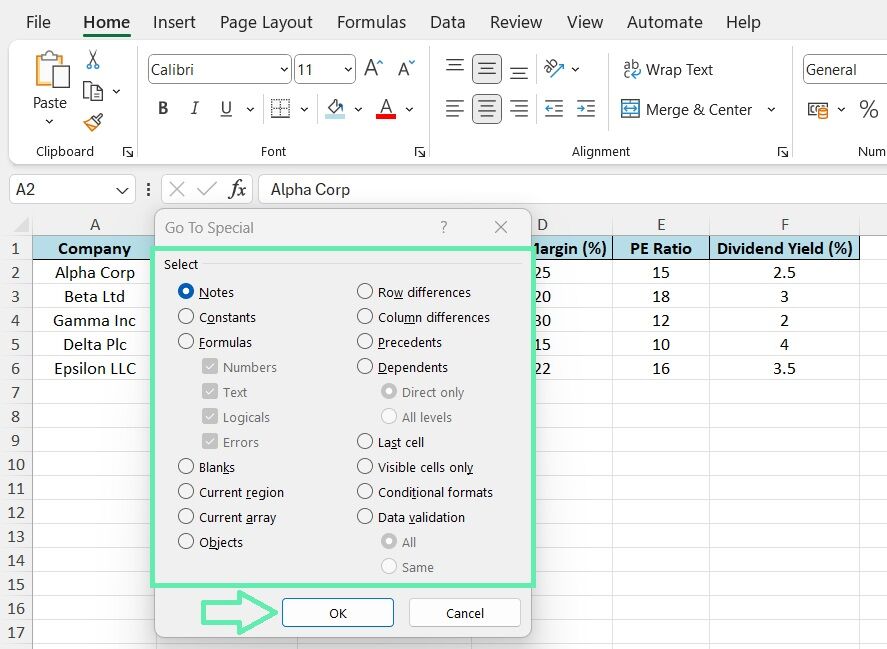
To utilize the said feature, press Ctrl+G to launch the Go To dialog box and then click on the ‘Special‘ button. It will allow you to select cells based on different formatting criteria, including cells with a particular font color, border, or number format.
Another advanced technique is writing simple macros to automate the process of searching for and highlighting cells with specific formatting. Macros are essentially a series of recorded or programmed actions that can be executed with a single click.

By creating a macro that searches for specific formatting criteria and applies a distinct highlight color, finance professionals can quickly identify and analyze relevant data points in their financial models.

Real-World Applications in Finance

The ability to efficiently search for cell formatting in Excel is invaluable for investment bankers and finance professionals. Let’s consider a few real-world scenarios where such a skill can be applied:

Identifying Trends

Suppose an investment banker is analyzing a company’s financial statements over multiple years. By applying consistent formatting to key metrics such as revenue, profit margins, and cash flow, they can quickly identify trends and patterns using formatting search techniques.

For example, by searching for cells with a green background, the banker can highlight years of positive growth, while red backgrounds may indicate periods of decline.

Risk Assessment

During investment evaluation, bankers can use risk assessment techniques to identify investments with significant risks. By applying conditional formatting in spreadsheets, bankers can highlight investments that exceed predefined risk levels, such as high debt ratios or insufficient liquidity. It allows them to easily identify potential issues and make informed decisions regarding the potential success of the investment opportunity.

Comparative Analysis

When comparing multiple companies or investment options, consistent formatting is crucial to accurate analysis. By standardizing the formatting of key financial metrics across different datasets, an investment banker can use formatting search techniques to quickly locate and compare specific data points. It can help in identifying the best-performing companies or the most attractive investment opportunities based on predefined criteria.

Practice Dataset for Investment Bankers

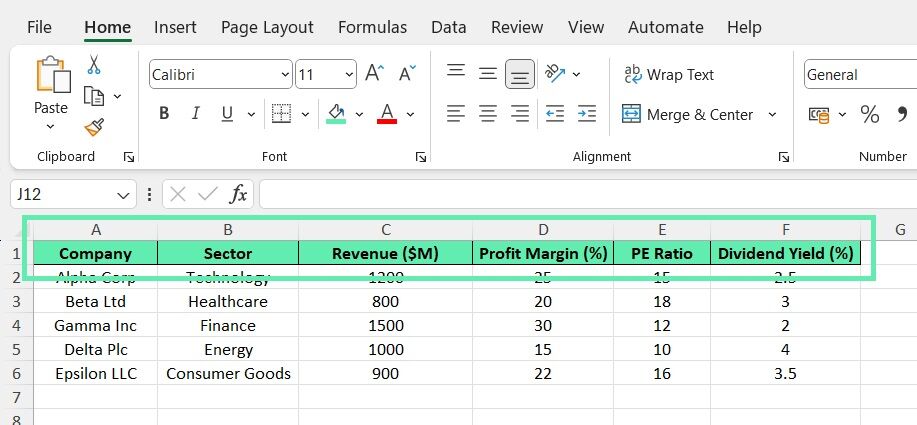
To help investment bankers practice and master the techniques discussed in this blog post, we created a sample dataset containing financial information on various companies. The dataset includes details such as company name, sector, revenue, profit margin, price-to-earnings (PE) ratio, and dividend yield.

1. Apply consistent formatting to the header row, such as bold font and a distinct background color.
2. Use conditional formatting to highlight companies with profit margins above a certain threshold (e.g., 20%) in green and those below the threshold in red.
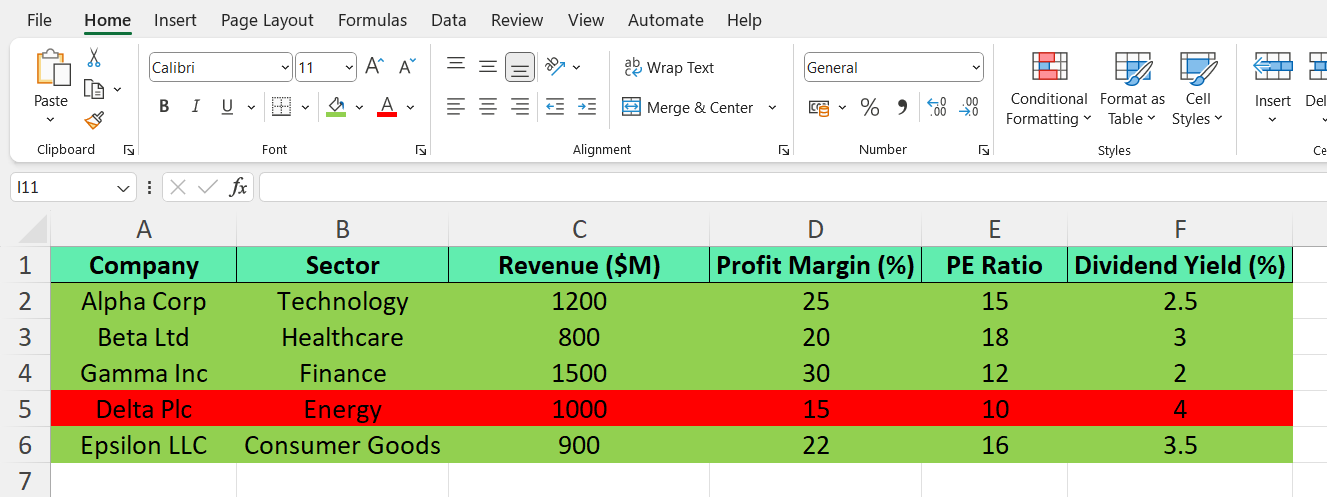
3. Apply a number format to the PE ratio column to display the values with two decimal places.

4. Use the Find and Replace feature to search for cells with a specific font color or background shade and navigate through the results.

5. Create a simple macro to automatically highlight cells that meet specific criteria, such as companies with a dividend yield higher than 5%.

By practicing the above techniques on the sample dataset, investment bankers can familiarize themselves with the various formatting search tools and apply them efficiently in their real-world financial analysis and reporting tasks.

Conclusion

Harnessing the power of cell formatting search techniques with the help of Macabacus allows finance professionals and investment bankers to pinpoint and examine specific patterns in large datasets efficiently. It enables them to uncover trends, evaluate risks, and make well-informed investment decisions.

Integrating the said techniques into their workflows enhances the clarity and readability of their financial reports, facilitating effective communication with stakeholders and yielding improved outcomes.

For finance professionals, aiming to elevate their Excel proficiency, practicing the different search techniques is crucial. By experimenting with the above sample dataset and exploring various formatting options, you can see the transformative impact of such tools on your financial analysis and reporting capabilities. To learn more, check out Macabacus.

Build Models & Decks 10x Faster with Macabacus

Gain access to 100+ shortcuts, formula auditing visualizations, easy Excel-to-PowerPoint linking, and productivity tools to build models and presentations faster than ever.

Discover more topics

Download The State of M&A Transactions
Download this report for expert guidance on innovative structures, cost-effective financing, and antitrust strategies to accelerate deals.
Read more
DCF Excel Template
Elevate your investment analysis with our free DCF model template. Understand discounted cash flow principles and perform accurate valuations in Excel.
Read more
Operating Model Excel Template
Download our free operating model Excel template. Forecast revenue, expenses, and key financial metrics for better decision-making.
Read more
LBO Excel Model
Try LBO modeling with our comprehensive Excel template. Understand key concepts, calculate returns, and gain actionable insights.
Read more