Using the SUMIF Function
A. Basic Use Case
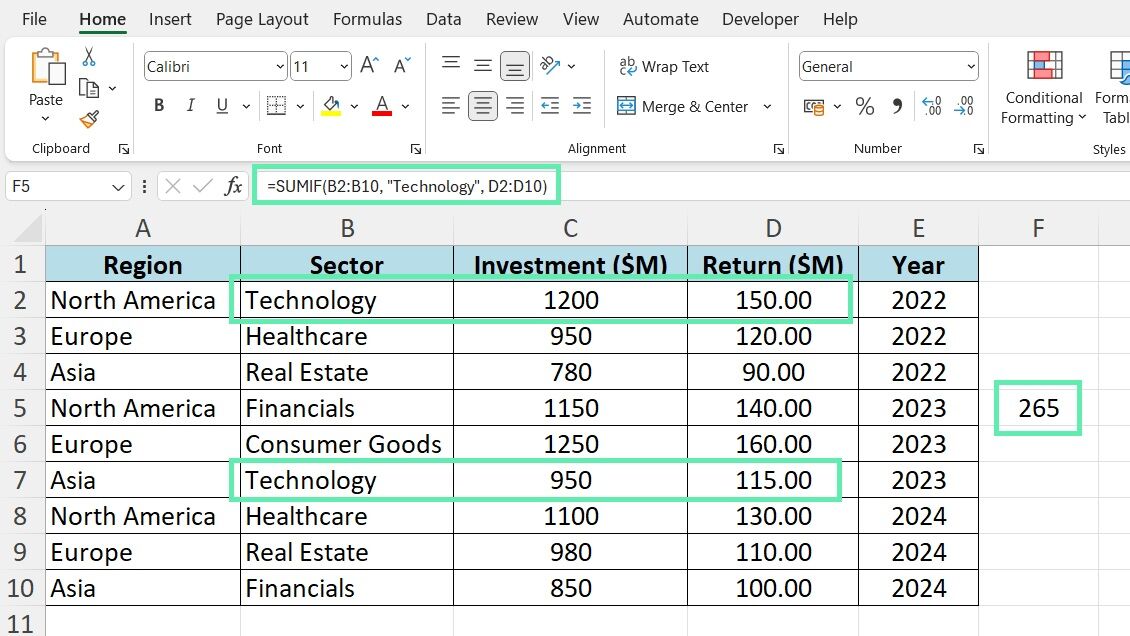
Let’s say you want to calculate the total returns from investments in the Technology sector using SUMIF.
Here’s how you would use SUMIF:
Step 1: Assume your data is in an ” InvestmentData ” table with columns for Sector, Return, and Year.
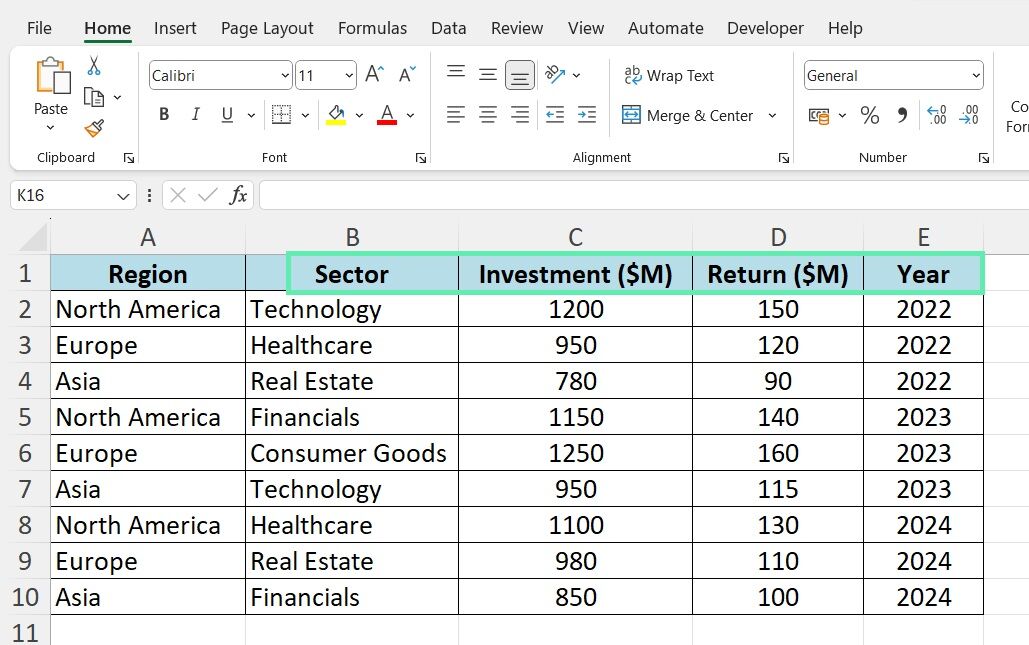
Step 2: In a cell where you want the result to appear, enter the following formula:
=SUMIF(B2:B11, “Technology”, D2:D11)
Here’s the breakdown of the formula:
- B2:B11 is the range where the criterion is checked.
- “Technology” is the criterion that cells in the B2:B11 range must match.
- D2:D11 is the range from which the numbers are summed where the corresponding cells in the range B2:B11 meet the criterion.
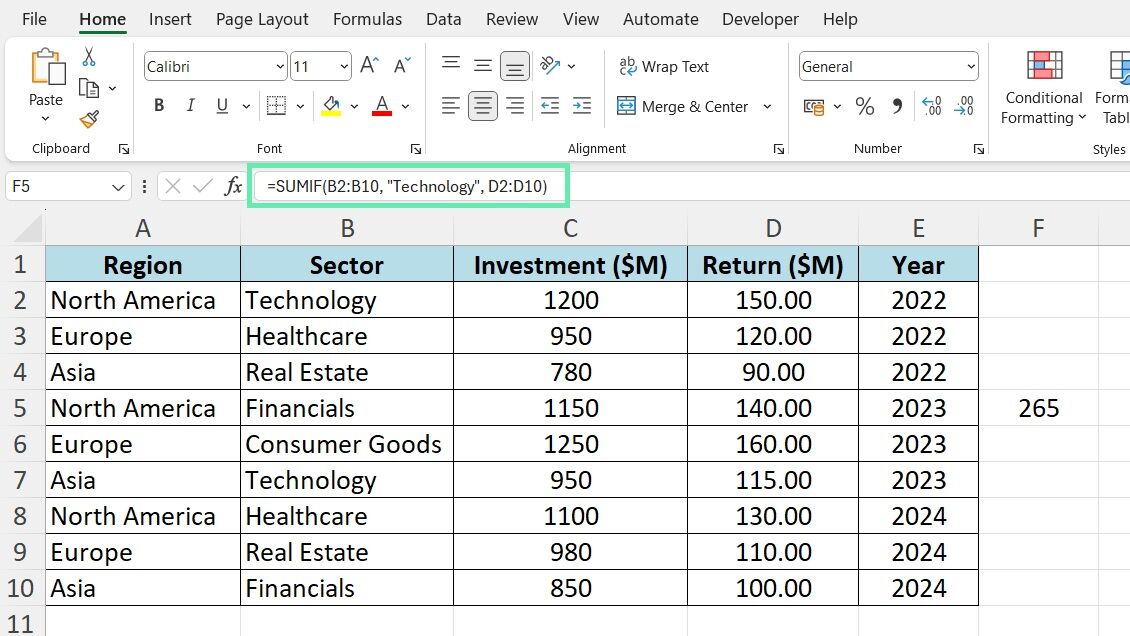
3. This will sum all the values in the ‘Return‘ column (D2:D11) for rows where the ‘Sector‘ column (B2:B11) is ‘Technology‘.
B. Advanced Use Case
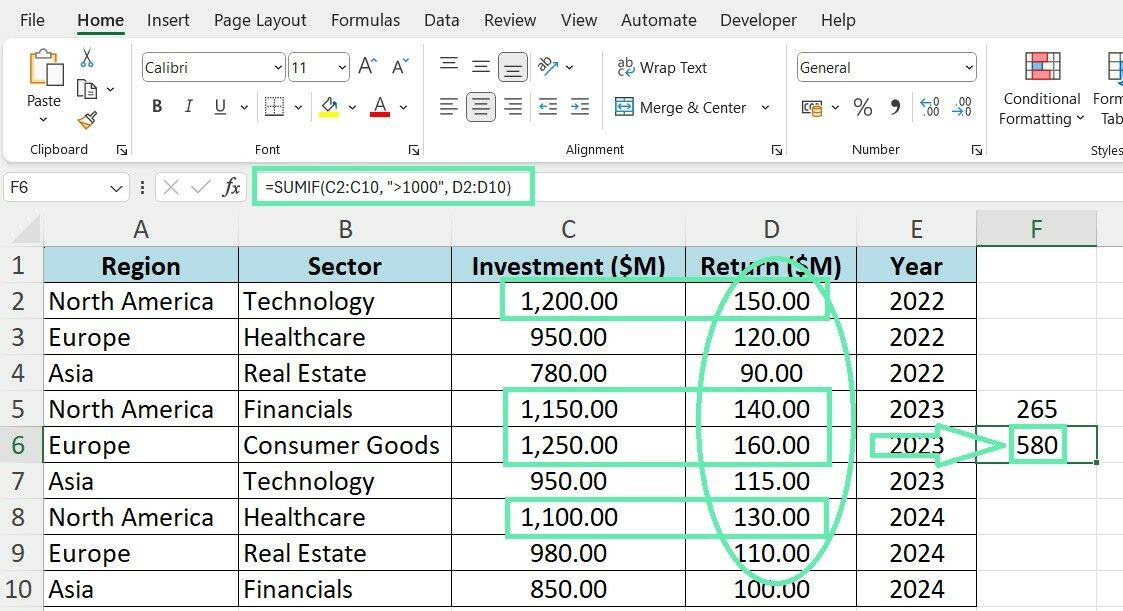
SUMIF is a function that can add up values in a range that meet specific numerical criteria or thresholds, such as the returns for investments that exceed $1000.
Here’s how you would modify the formula:
=SUMIF(InvestmentData[Investment Amount], “>1000”, InvestmentData[Return])
=SUMIF(C2:C10, “>1000”, D2:D10)
Here’s the explanation of the formula:
- C2:C11 is the range where the investment amount is checked
- >1000 is the criterion that the cells in the C2:C11 range must meet
- D2:D11 is the range from which the returns that meet the criteria are summed.
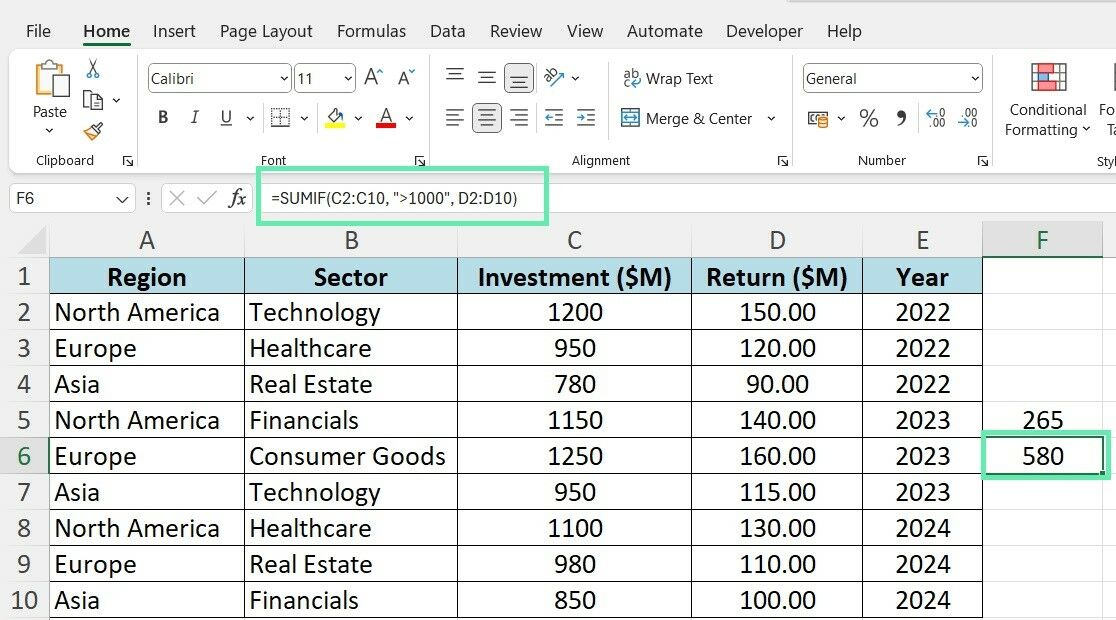
The above formula will sum all the values in the ‘Return‘ column (D2:D11) for rows where the ‘Investment‘ column (C2:C11) has values greater than $1000.
Using the SUMIFS Function
A. Basic Use Case
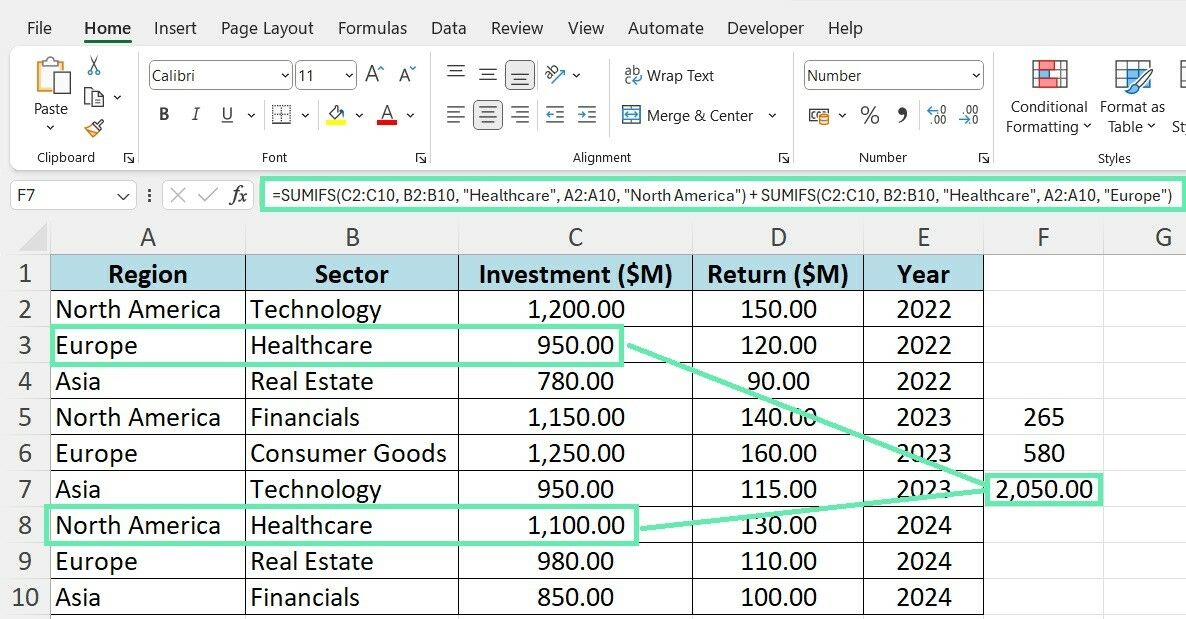
Let’s explore how SUMIFS can calculate total investments based on multiple criteria. If you want to determine the total investments made in the Healthcare sector from regions North America and Europe, here’s how you would use SUMIFS:
1. If your data is in the ‘InvestmentData’ table, put this formula in the desired cell:
=SUMIFS(InvestmentData[Investment Amount], InvestmentData[Sector], “Healthcare”, InvestmentData[Region], “North America”) + SUMIFS(InvestmentData[Investment Amount], InvestmentData[Sector], “Healthcare”, InvestmentData[Region], “Europe”)
=SUMIFS(C2:C10, B2:B10, “Healthcare”, A2:A10, “North America”) + SUMIFS(C2:C10, B2:B10, “Healthcare”, A2:A10, “Europe”)
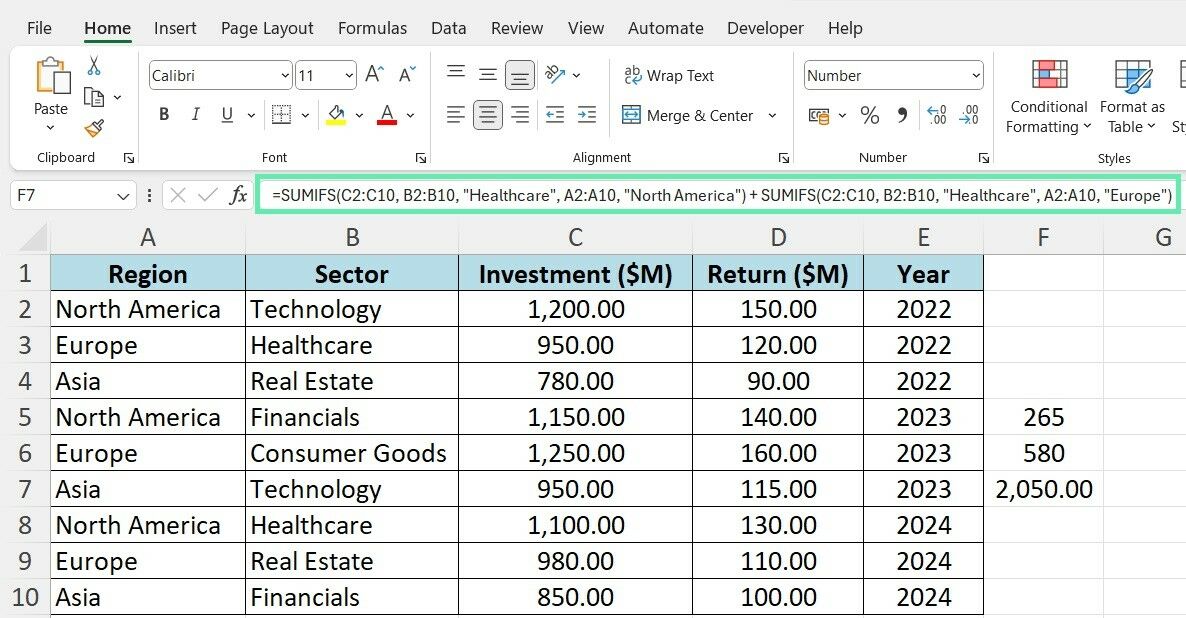
2. This formula adds the investment amounts for the ‘Healthcare‘ sector in ‘North America‘ and ‘Europe‘ separately and then sums the results.
B. Advanced Use Case
SUMIFS truly shines when you need to perform multi-criteria analysis. For instance, analyze returns by combining sector and regional data over multiple years. Here’s an example of how you could use SUMIFS to achieve this:
=SUMIFS(InvestmentData[Return], InvestmentData[Sector], “Real Estate”, InvestmentData[Region], “Asia”, InvestmentData[Year], “2022”)
=SUMIFS(D2:D10, B2:B11, “Real Estate”, A2:A11, “Asia”, E2:E10, 2022)
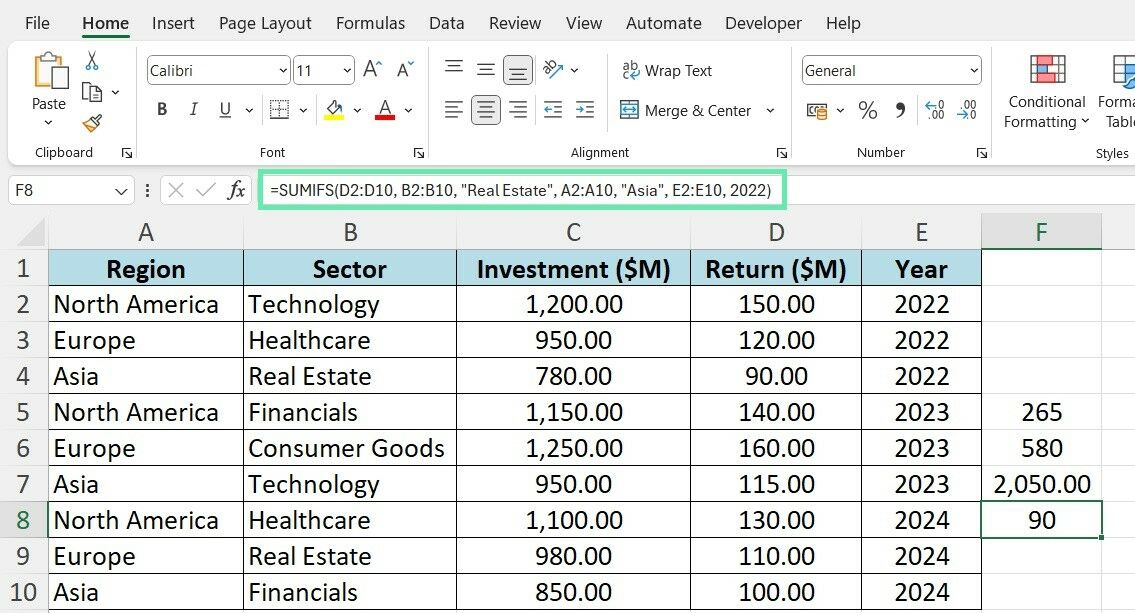
The above formula calculates the total returns for investments in the ‘Real Estate‘ sector in ‘Asia‘ for ‘2022‘.
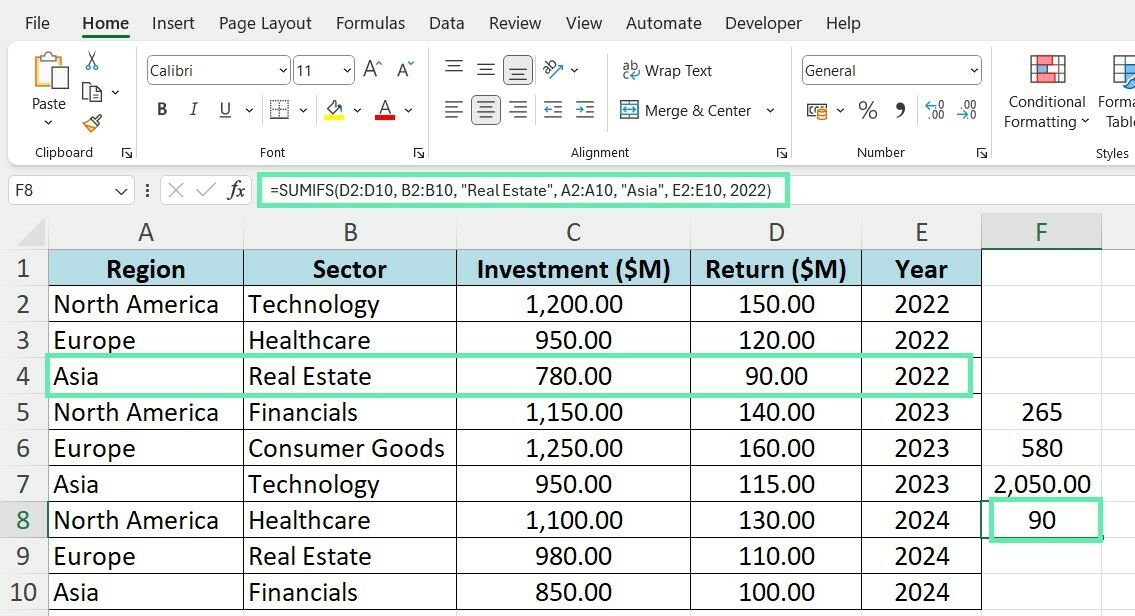
Modifying the criteria allows you to quickly analyze returns for different sectors, regions, and year combinations.
Tips and Tricks for Financial Professionals
SUMIF and SUMIFS become even more powerful when combined with other financial functions in Excel. Use SUMIF to calculate cash flows for a project and feed values into NPV (Net Present Value) for viability assessment. Similarly, you can use SUMIFS to calculate an investment’s IRR by gathering cash flows across multiple criteria.
When working with large financial datasets, optimizing the performance of your Excel workbook becomes crucial. Here are a few best practices to keep in mind:
- Use named ranges or tables to make your formulas more readable and more accessible to update.
- Avoid unnecessary calculations by using manual calculation mode when working on complex sheets.
- Leverage Excel’s data tools, such as PivotTables and PowerPivot, to analyze and summarize large datasets efficiently.
Common Errors and Troubleshooting
Even seasoned investment bankers can encounter errors when using SUMIF and SUMIFS. Some common issues include:
- #VALUE! error: This error occurs when non-numeric values are present in the criteria or sum range. You can fix it by adequately formatting your data and using the correct data types.
- #NAME? error: This is due to an unrecognized function/named range. Check the spelling and definition of named ranges.
- Incorrect results: Double-check your formula criteria and sum ranges to ensure they reference the correct cells and match the corresponding data.
Practical Applications in Investment Banking
SUMIF and SUMIFS can be extremely useful in investment banking for various real-world scenarios:
- Analyzing the performance of investment portfolios across different sectors, regions, and periods.
- Calculating the total exposure to specific industries or geographic markets for risk assessment purposes.
- Evaluating the historical returns of various investment strategies to inform future decision-making.
As you become more comfortable with SUMIF and SUMIFS, you can use them in advanced financial analysis workflows, such as:
- SUMIFS can be combined with other Excel functions, such as OFFSET and MATCH, to create reports that update automatically based on user input.
- Combine SUMIF and SUMIFS with conditional formatting to visually highlight key insights in your financial dashboards.
- Integrate the functions into Excel macros and VBA scripts to automate repetitive analysis tasks.
Conclusion
Excel’s SUMIF and SUMIFS functions are essential tools for efficient data analysis in investment banking. This blog provides detailed information on their syntax, practical applications, and tips for improving financial data structuring and analysis.
Use SUMIF and SUMIFS functions to boost your efficiency and decision-making abilities as an investment banker. These tools help navigate the financial sector complexities to achieve significant organizational results.
To ensure accuracy, consistency, and brand compliance across all financial documents, Macabacus’s solutions streamline operations in Microsoft Office for finance professionals. With Macabacus, you can save time on tasks and focus on strategy. Elevate your investment banking performance to new heights. Check out Macabacus today!


