Analyzing Financial Data
Excel offers valuable functions and features for financial analysis. Mastering these tools enables efficient data analysis and informed decision-making. Here are some of the most important ones:
1. VLOOKUP and INDEX-MATCH: These functions help you search and retrieve data from different tables based on specific criteria, which is particularly useful for working with large datasets across multiple sheets or workbooks.

2. Pivot Tables: Pivot tables are powerful for summarizing and analyzing data, enabling quick report generation and trend identification.

3. Conditional Formatting: This feature allows you to highlight cells visually or ranges to quickly identify outliers, trends, or deviations from the norm.

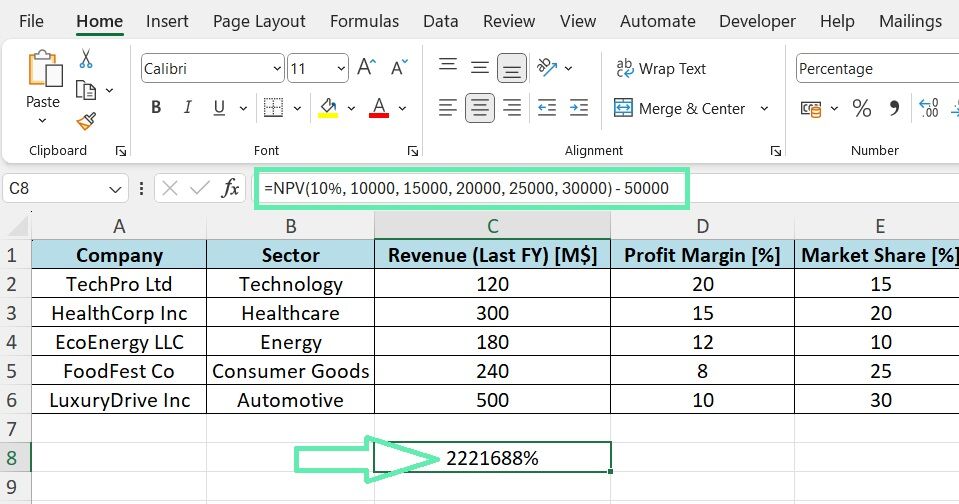
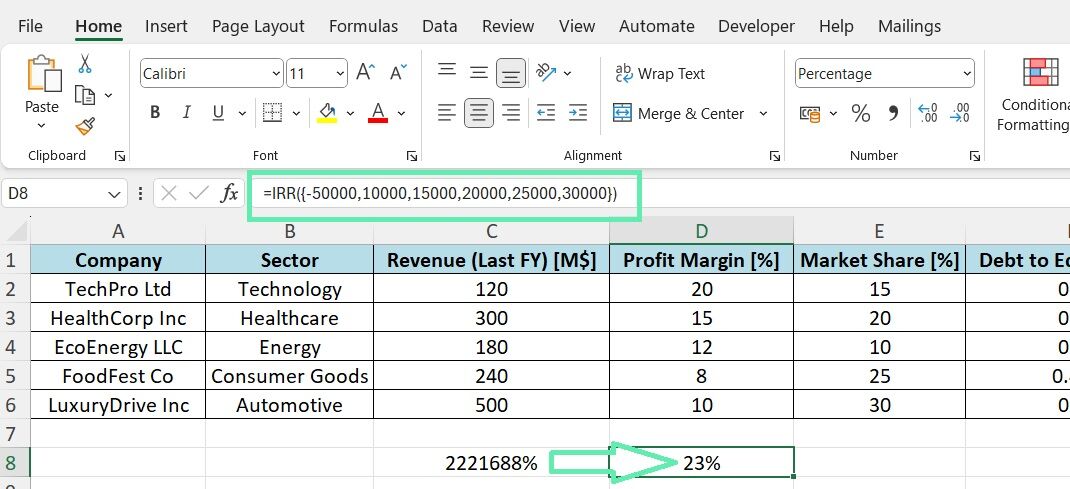
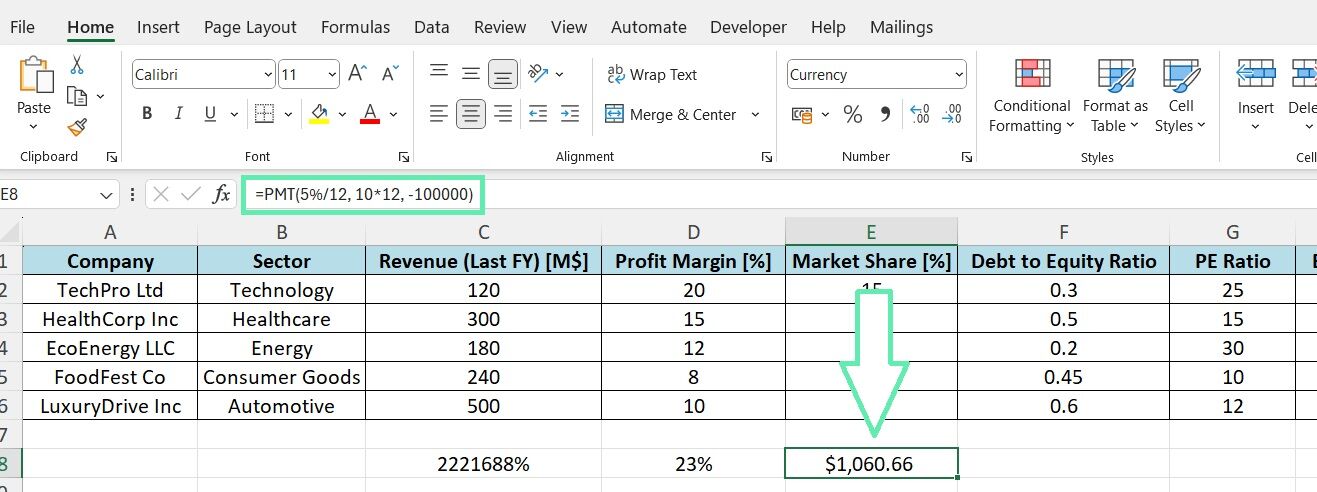
4. Financial Functions: Excel includes essential financial functions, such as NPV, IRR, and PMT, for investment analysis and modeling.

The NPV function only calculates the present value of future cash flows.

The IRR formula calculates the internal rate of return for the investment.

The PMT formula calculates the monthly payment required to pay off the loan.
Understanding the syntax and limitations of these tools is essential to apply them effectively. When using VLOOKUP, ensure the lookup value is in the leftmost column. When creating pivot tables, select the correct fields and aggregation methods for meaningful insights.
Advanced Financial Analysis
Another powerful technique in financial analysis is scenario and sensitivity analysis. This technique assesses how changes in factors like interest rates and market conditions can impact your investments.
To perform scenario analysis in Excel:
Step 1: Set up your financial model with the critical input variables and output metrics.
Step 2: Use the ‘Scenario Manager’ in the ‘Data’ tab to define scenarios by specifying input variable values.

Step 3: Run the scenarios, compare results, and assess potential risks and opportunities for each.
By using advanced analysis techniques, you can understand the financial risks and opportunities associated with investments and make more informed decisions.
Crafting the Due Diligence Report
After analyzing the financial data, it’s time to present your findings in a clear due diligence report. This report will communicate your insights and recommendations to stakeholders and decision-makers.
Here are the essential components of a due diligence report in investment banking:
- Provide a high-level summary of your analysis’s main findings, risks, and opportunities.
- Give a brief background on the analyzed company, including its history, business model, and market position.
- Present a detailed financial analysis, including historical performance, key ratios, and comparisons to industry benchmarks.
- Highlight the potential risks associated with the investment, such as market volatility, regulatory changes, or competitive threats.
- Provide a range of valuation estimates based on different methodologies (e.g., discounted cash flow and comparable company analysis).
- Offer concluding thoughts and recommendations on whether to proceed with the investment and any potential mitigating actions.
Use clear headings and bullet points to keep your report jargon-free.
Visualizing Financial Data
Visual aids like charts and graphs effectively convey complex financial information, helping stakeholders grasp crucial insights and trends without getting overwhelmed by numbers.
Here are some best practices for creating compelling financial data visualizations in Excel:
- Choose the chart type that best represents the data you want to convey.
- Keep it simple and avoid cluttering charts with too much information. Stick to a clean, minimalist design focusing on the critical message.
- Maintain consistent formatting across all charts for a professional and cohesive report.
- Include clear titles, labels, and legends for easy chart interpretation.
- Highlight important data insights using annotations, trendlines, or data labels.
By incorporating well-designed visualizations into your due diligence report, you can significantly enhance its impact and effectiveness in communicating your analysis to stakeholders.
Automating Financial Report Generation
Creating due diligence reports can be time-consuming, especially when dealing with large datasets or multiple companies. Fortunately, Excel provides powerful automation tools like macros and VBA to streamline report generation.
Here’s how you can use macros and VBA to automate financial report generation:
- Record a macro in Excel to capture the steps for creating a report, including formatting cells, generating charts, and exporting to PDF.
- Refine and customize the recorded macro in the VBA editor to meet your requirements.
- Write your own VBA functions to perform complex calculations or unavailable data manipulations through Excel’s built-in functions.
- Develop a report template that can be populated automatically using macros.
- Use VBA to automatically refresh the data sources and update the report with the latest information.
Automating tasks and standardizing report generation can significantly reduce the time and effort needed to produce high-quality due diligence reports.
Another powerful automation tool in Excel is the creation of dynamic dashboards. These reports offer real-time insights into financial metrics and performance indicators by linking to data sources and using Excel tools like slicers and pivot tables. This creates a self-updating dashboard that allows stakeholders to explore and analyze the data independently.
Finalizing and Distributing the Report
Before sharing your due diligence report with stakeholders, it’s crucial to conduct a thorough review and quality assurance process to ensure its accuracy, completeness, and professional standards.
Here’s a checklist for reviewing and refining your report:
- Double-check calculations: Verify that all financial calculations and formulas are accurate and consistent throughout the report.
- Proofread the text: Review the report for any typos, grammatical errors, or unclear language that may undermine its credibility.
- Validate data sources: Confirm that all data sources used in the report are reliable, up-to-date, and properly cited.
- Check for consistency: Ensure that the formatting, terminology, and structure of the report are consistent across all sections.
- Solicit feedback: Share a draft of the report with colleagues or subject matter experts for their input and suggestions for improvement.
By going through this rigorous quality assurance process, you can ensure that your due diligence report meets the highest standards of accuracy, clarity, and professionalism.
Securely Sharing Financial Reports
Due diligence reports often contain sensitive financial information that needs to be protected. Excel provides tools and best practices for securely sharing financial reports within and outside the organization.
Here are some critical steps for protecting sensitive data in Excel:
- Set a password to restrict access and modifications to the Excel file, safeguarding the data from unauthorized users.
- Use Excel’s built-in encryption feature to secure the file with a strong password.
- Apply data validation rules or lock specific cells or sheets to prevent accidental or intentional changes to the data.
- When sharing the report externally, use secure file-sharing platforms with access control, expiration dates, and audit trails.
- If the report contains highly sensitive or confidential information, it should be redacted or removed before sharing.
Adhering to the above best practices ensures secure sharing of due diligence reports with authorized stakeholders.
Conclusion
Creating a solid due diligence report using Excel is essential for finance professionals in investment banking. Using Excel’s various features and best practices, you can analyze financial data, create reports, and make informed investment decisions. Set up your Excel environment with add-ins and tools, organize your data, use functions and formulas to clean and analyze financial data, and apply scenario analysis for risk assessment and opportunities.
When creating your report, focus on a clear and logical structure to guide readers through your analysis. Use data visualizations to convey critical insights and consider automating repetitive tasks using macros and VBA for efficiency.
Finally, conduct a thorough quality assurance review and follow best practices for securely sharing your reports with stakeholders. Mastering due diligence reports in Excel will help you excel in finance and investment banking. Additionally, Macabacus offers solutions for accurate and efficient reports, trusted by leading firms worldwide.


