Exporting charts and graphs from Excel as image files can be incredibly useful. It allows you to easily insert high-resolution charts into reports, presentations, websites, and more. In this post, we’ll cover multiple ways that you can save Excel charts as images. While many of us use the convenient screenshot, for important presentations, you’ll want to use the highest quality images.
Build Financial Models in Minutes
Enterprise-Grade Financial Modeling used by 80,000+ professionals across Investment Banking, Private Equity, and Corporate Finance. Ensure consistency, accuracy, and efficiency across your entire organization.
Saving Excel charts as image files can make them much more versatile, shareable, and protected. For starters, by exporting charts as images, you gain the ability to seamlessly insert them into Word documents, PowerPoint presentations, and web pages while retaining full quality across platforms. Additionally, image formats have wider compatibility across different email clients compared to Excel file formats. This makes it easier to share charts through email.
Furthermore, image charts can be used in non-Office applications that don’t allow Excel embedding. Transitioning to sharing benefits, image sizes are smaller than Excel sheets, enabling easier online sharing without requiring recipients to have Excel.
Moreover, saving as an image protects the chart formatting from accidental changes that could occur if left as an Excel file. Finally, with the ability to edit charts in graphics editors like Photoshop, images provide more flexibility for enhancing Excel visualizations outside of spreadsheets. In summary, the versatility and shareability of charts can be greatly improved by saving Excel charts as images.
Key Advantages for Presentations and Reports:
Saving Excel charts as images makes them easier to use in presentations and reports. When charts are exported as images, they can be quickly inserted into Word documents, PowerPoint slides, or even web pages while keeping their quality intact. This avoids formatting problems that might happen when copying charts directly from Excel. Additionally, saving charts as images protects them from accidental changes, ensuring that they look exactly how you intended.
You can also edit the charts in graphic design programs like Photoshop, giving you more control over their appearance, which is especially useful when preparing professional materials.
Improved Compatibility Across Platforms
Exporting charts as images improves their compatibility. Image formats like PNG or JPG work better across various email clients and platforms, making it easier to share charts by email without worrying if the recipient has Excel installed. Image files are smaller than Excel files, so they’re also easier to send and upload online.
Furthermore, images can be used in non-Microsoft Office applications that don’t support Excel embedding, making them more flexible for a wider range of uses. This ensures your charts remain accessible and look good no matter where they’re viewed.
How to Save Chart as Image in Excel: PNG, JPG, GIF, PDF
Excel provides built-in options to save charts as images. Here are the steps:
Create your chart in Excel as usual. Select and format it how you want.
With your chart selected, right-click and “Save as Picture…”
Choose the format and location.
And that’s it! Your Excel chart is exported and saved as an image file.
The image resolution will be high quality. You can set the exact dimensions (in pixels) before exporting in the export dialog box.
Take a Screenshot of the Chart and Save It:
Taking a screenshot of your Excel chart is a quick and easy way to save it as an image. One major advantage is its simplicity; you can capture the chart instantly without any technical skills required. This method is also versatile, allowing you to edit the screenshot in an image editor before saving it. However, there are some downsides to consider. Screenshots may result in lower image quality, especially when resizing. Additionally, this method lacks the precision of exporting, which keeps your chart’s original dimensions and clarity intact. Weigh the pros and cons before choosing this image-saving method.
Copy a chart to a graphics program and save as an image:
Another easy way to save a single Excel chart as an image is by copying it into a graphics program like Microsoft Paint or Photoshop. First, select the chart in Excel, right-click, and choose “Copy.” Open your preferred graphics software, paste the chart, and then save the file in your desired image format, such as PNG, GIF or JPG.
This method offers greater control over image editing and customization. After pasting your chart into software like Photoshop or Paint, you can adjust colors, add annotations, and enhance the overall appearance.
Export an Excel chart to Word and PowerPoint:
To export an Excel chart to Word or PowerPoint, select the chart in Excel, right-click, and choose “Copy.” Then, open your Word document or PowerPoint slide, right-click, and select “Paste.” This method allows you to transfer the chart without losing any formatting. Once pasted, you can resize or adjust the chart as needed within Word or PowerPoint. This option is ideal for integrating Excel visuals into presentations or reports quickly while maintaining flexibility for further customization directly in those programs.
Save a chart as image using a VBA macro:
If you frequently export Excel charts as images, automating the process with a VBA macro can save you time. You can find pre-existing macros, like the one by Jon Peltier, to simplify your task.
To use it, create a folder on your D: drive for your images, named “My Charts.”
First, enable the Developer tab in Excel by going to File > Options > Customize Ribbon. Then, click on the Macros icon. Name your macro (e.g., SaveSelectedChartAsImage) and click Create. In the Visual Basic Editor, add the line:
Save your workbook as an Excel Macro-Enabled Workbook (*.xlsm). To run your macro, select the chart, return to the Developer tab, and click the Run button. Your chart will be saved as a .png file in your chosen folder. You can also change the file format to .jpg or .gif by adjusting the file extension in the macro.
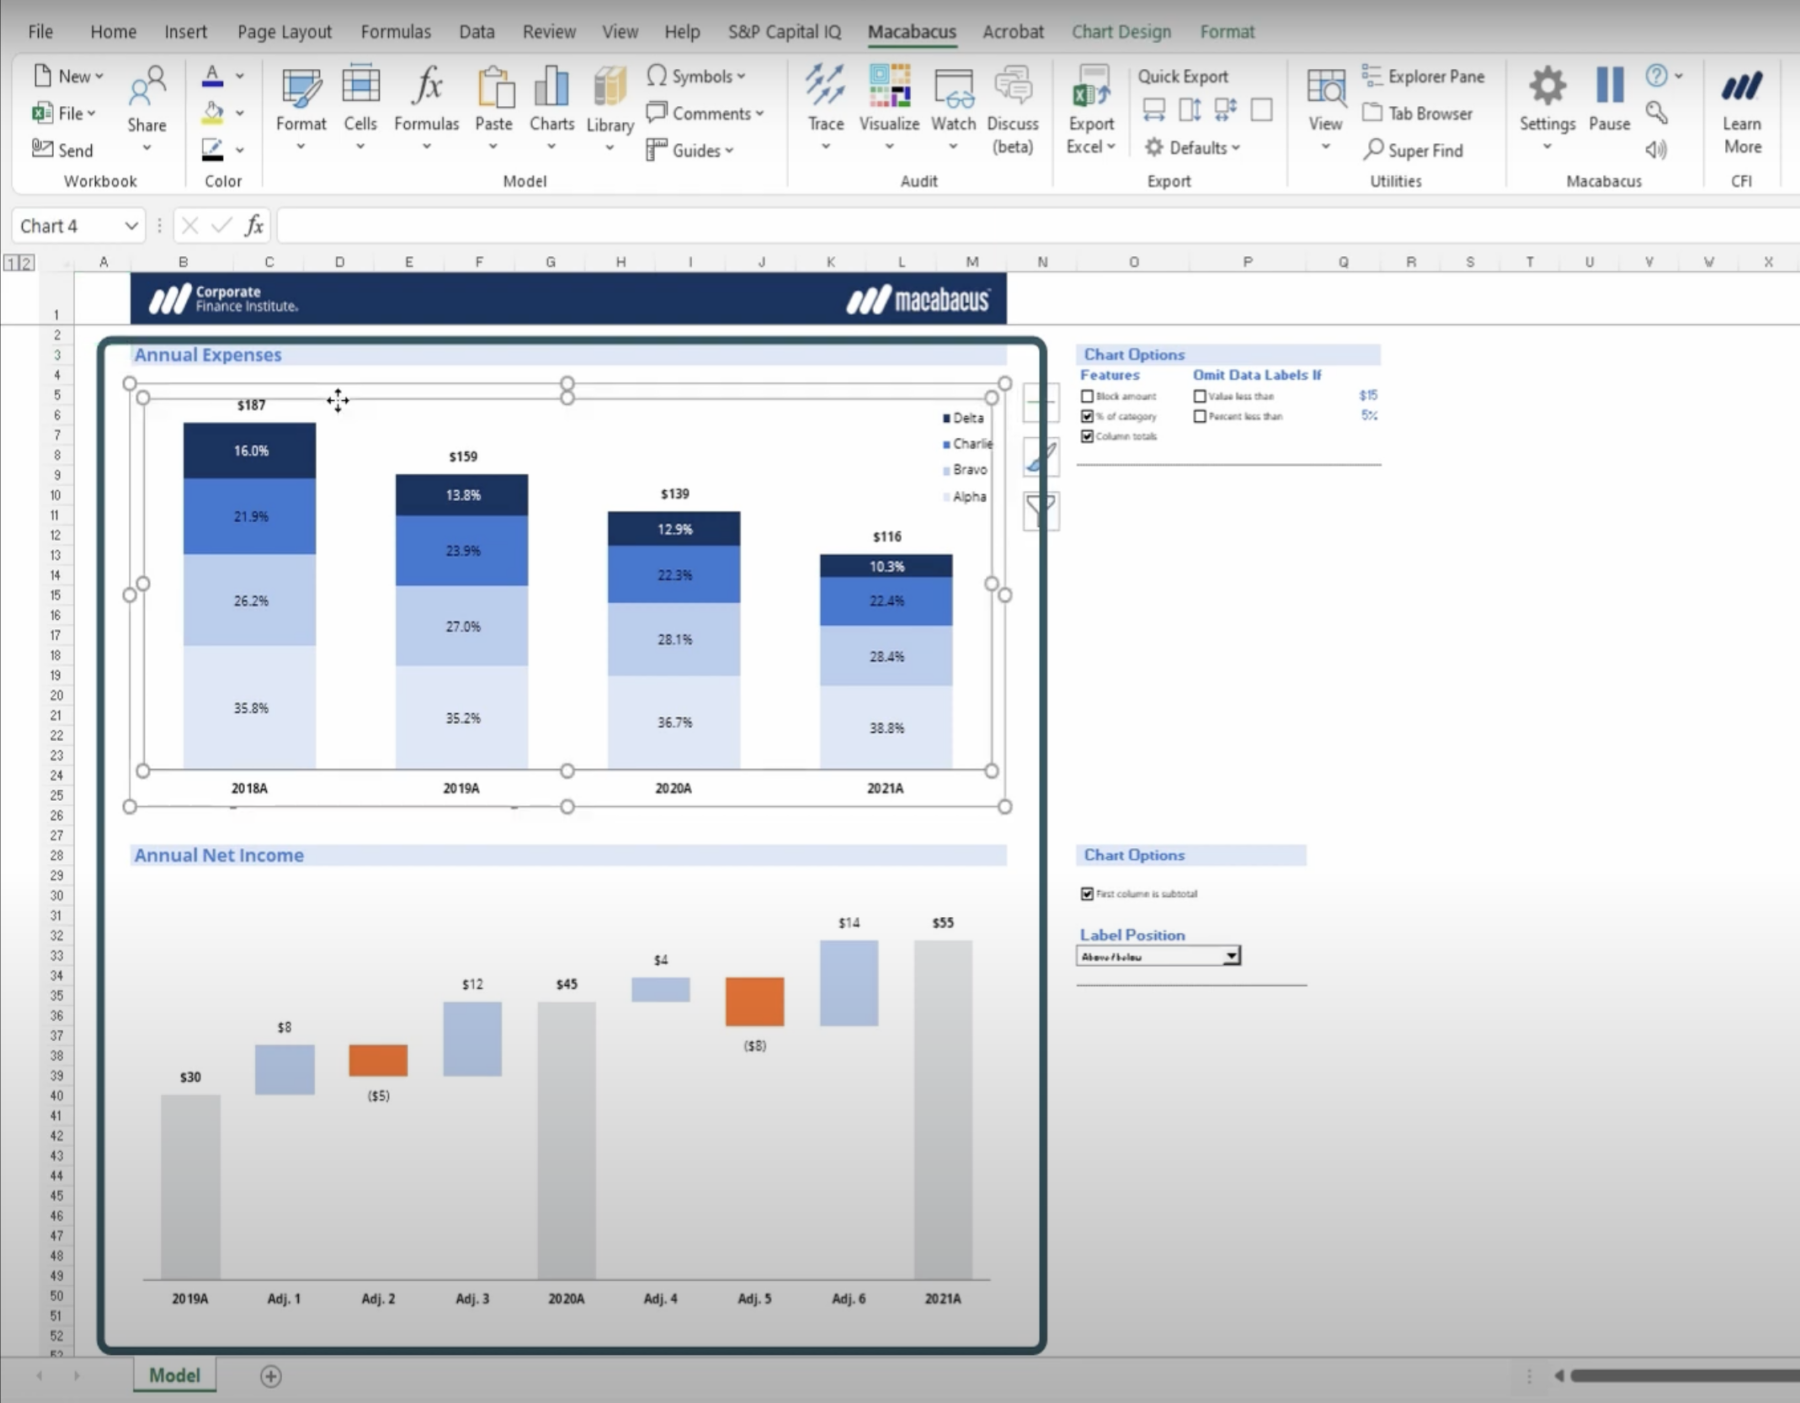
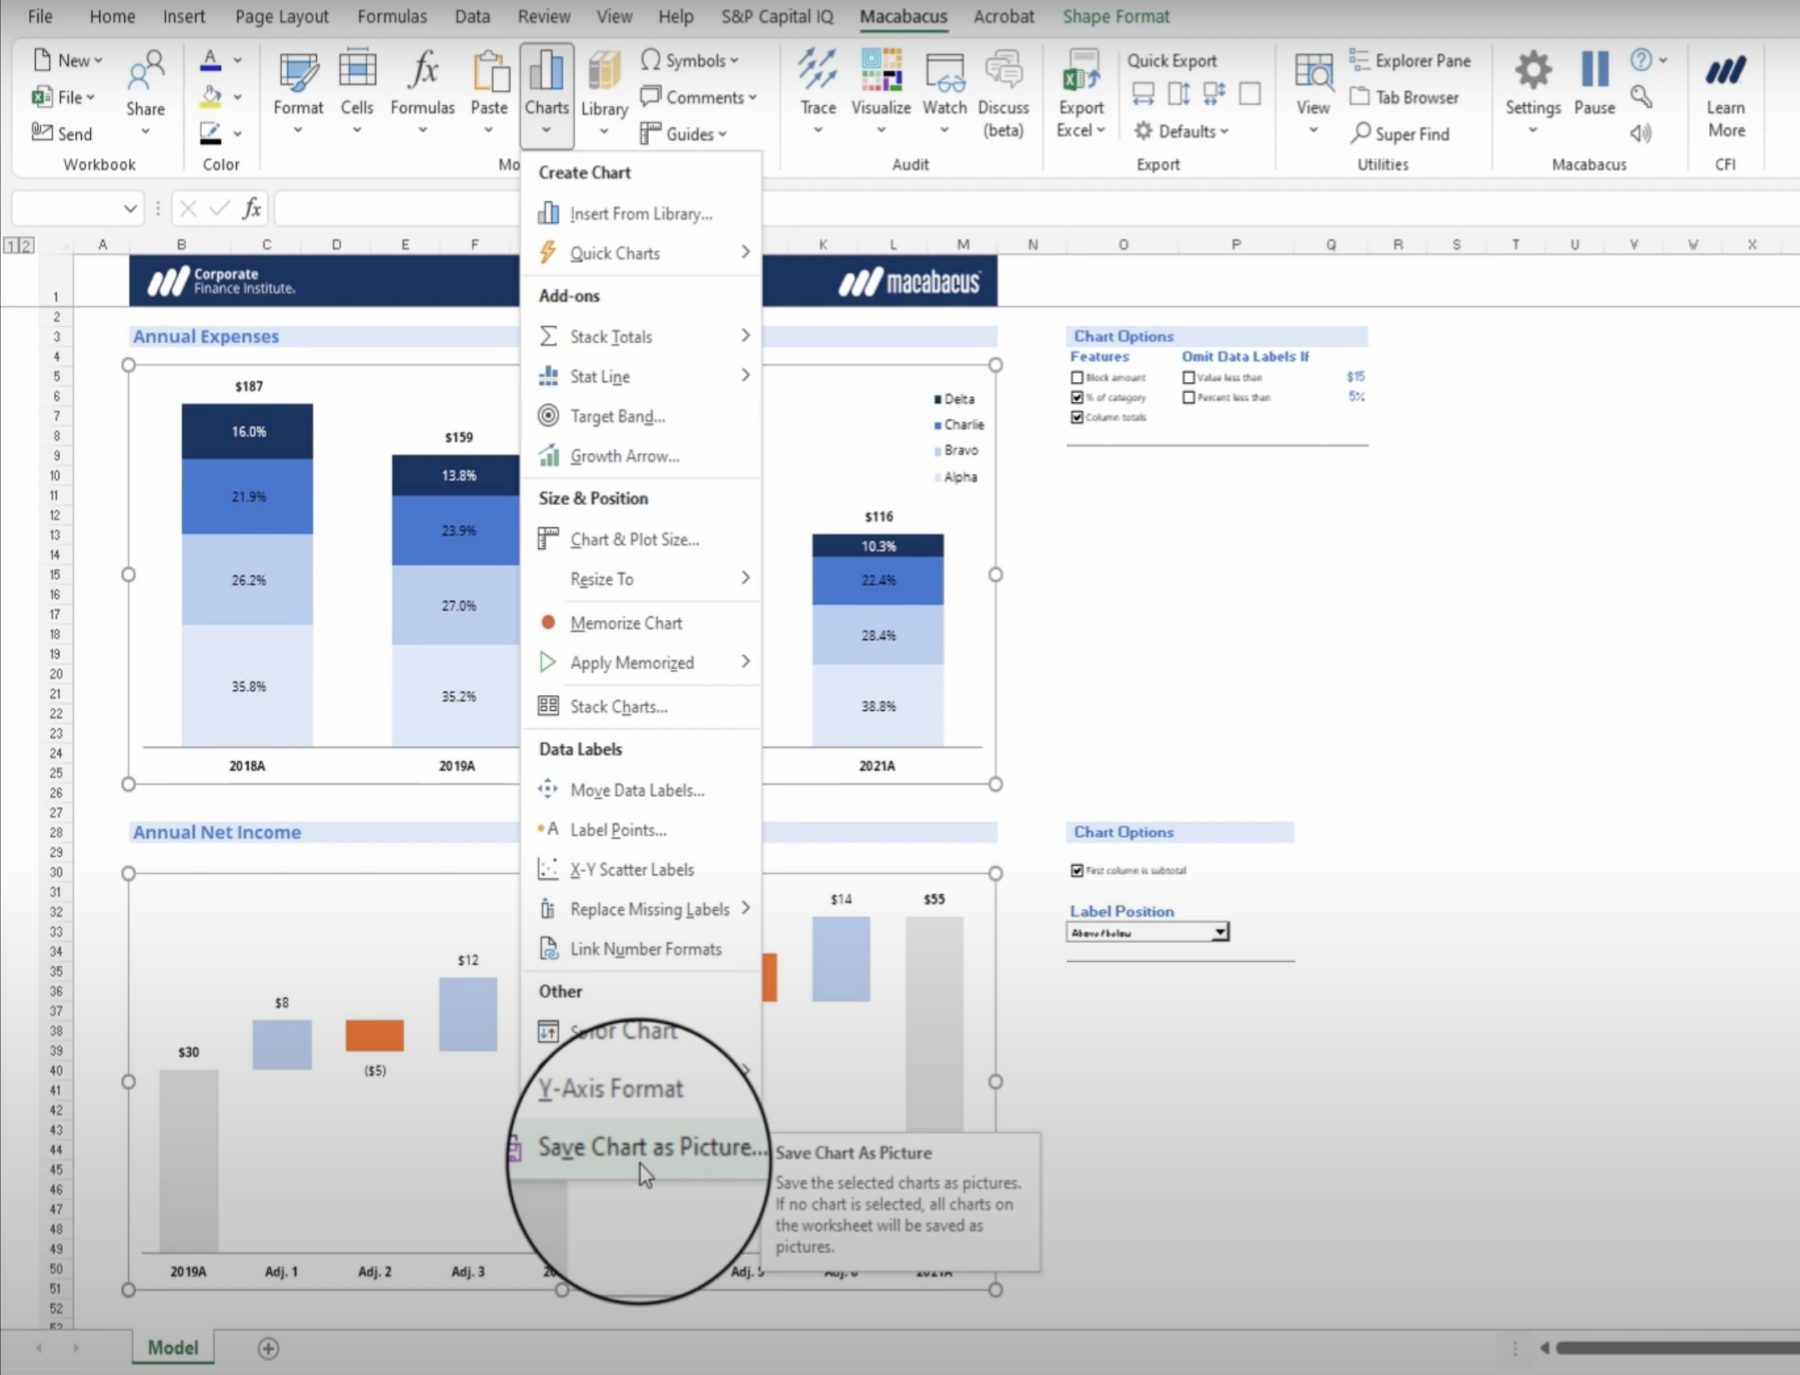
How to Save Multiple Charts as Images in One Go with Macabacus
If you work with Excel charts frequently, the add-in makes exporting them as images much easier. With Macabacus installed, you can:
Select multiple charts at once
Navigate to the Macabacus Ribbon
Click Charts > “Save Chart as Picture” to export all of them
Watch This Video on Saving Charts With Macabacus
Key Benefits of Saving Images with Macabacus
Export unlimited charts in just a few clicks.
Charts are automatically named sequentially for the organization.
Works for all chart types and retains full formatting.
Saves tons of time vs. exporting individually.
Perfect when you have dozens of charts to export on a model.
For frequent Excel users working with many charts, Macabacus can save hours of time and effort exporting charts as images. It’s a highly useful tool for automating the process.
Additional Options to Save Charts as Images
Here are some other options/tips for saving Excel charts as images:
Copy (Ctrl+C) the chart and paste (Ctrl+V) into a graphics editor to save as an image file.
Use VBA macros to automate exporting charts as pictures.
Adjust image resolution before exporting – higher for printing, lower for web.
Instead of static images, save/export as an interactive HTML file to retain chart functionality.
Export the chart alone, or export with surrounding worksheet data.
Image Format Definitions
When saving Excel charts as images, which file format should you use? Here’s an overview:
PNG: Great all-purpose choice. Supports transparency. No loss of quality. Best for print or high-resolution digital use.
JPG: Useful for photos or complex charts. Smaller file sizes than PNG, but some quality loss is possible. Many times, you can find a balance and get a serviceable resolution with a smaller file size.
GIF: For simple charts with limited colors/gradients. Small files. Note animated GIFs are not supported.
BMP: Large, uncompressed files. Quality similar to PNG but larger file size.
TIFF: Lossless compression. Very large high-quality files. More for professional printing use.
So, in summary, PNG and JPG are the most common and useful formats for Excel charts as images. PNG gives the best quality, while JPG is better for file size reduction.
Tips for Exporting Quality Excel Charts
Garbage in, garbage out. Follow these tips to get the highest quality charts when exporting:
Refine and format your Excel chart before exporting – colors, labels, plot area, font sizes, etc.
Check the image resolution or dimensions. Increase for printing quality.
For JPGs to Excel, use higher quality settings, e.g., 90%+ to minimize compression artifacts.
Know the difference between raster vs vector formats. Raster (PNG, JPG) is better for Excel charts.
Avoid compressing images multiple times. Export once from Excel at maximum quality.
If editing in another program, save a copy in Excel format first to retain vector data.
Ensure your chart colors/gradients/textures are optimized for the output format.
Check out the image on both screen and in print. Printed output may look different.
Following these tips will give you print-ready Excel charts when exporting and get the most out of Excel’s image-saving capabilities.
Saving your Excel charts and graphs as images is simple and offers many benefits for sharing and using your charts outside of Excel. The built-in Export feature provides an easy way to save charts in standard image formats like PNG, JPG, and more while retaining full quality. For frequent Excel chart users, tools like Macabacus can automate exporting multiple charts as images with just a few clicks.
Try Macabacus for free and export multiple charts as high-resolution images today.
Build Financial Models in Minutes
Enterprise-Grade Financial Modeling used by 80,000+ professionals across Investment Banking, Private Equity, and Corporate Finance. Ensure consistency, accuracy, and efficiency across your entire organization.
Elevate your investment analysis with our free DCF model template. Understand discounted cash flow principles and perform accurate valuations in Excel.